Basic Diagramming
ConceptDraw DIAGRAM with the specific tools you need to easily draw flowcharts, block diagrams, bar charts, histograms, pie charts, divided bar diagrams, line graphs, area charts, scatter plots, circular arrows diagrams, Venn diagrams, bubble diagrams, concept maps, electrical circuit diagrams, schematics,and others.Use Basic Diagramming solution to draw you own diagrams, charts and graphs for graphic communication, explanation of business and personal ideas and concepts, simple visual presentation of numerical data, complex structures, logical relations, step-by-step flows of actions or operations.

Picture Graphs
Typically, a Picture Graph has very broad usage. They many times used successfully in marketing, management, and manufacturing. The Picture Graphs Solution extends the capabilities of ConceptDraw DIAGRAM with templates, samples, and a library of professionally developed vector stencils for designing Picture Graphs.
How to Draw a Line Graph
In your work activity you need regularly draw the line graphs? And each time you ask yourself a question "How to Draw a Line Graph easier and faster?". The desire to automate the line graphs drawing process led to the creation of Line Graphs solution from Graphs and Charts area of ConceptDraw Solution Park.
Bar Graphs
The Bar Graphs solution enhances ConceptDraw DIAGRAM functionality with templates, numerous professional-looking samples, and a library of vector stencils for drawing different types of Bar Graphs, such as Simple Bar Graph, Double Bar Graph, Divided Bar Graph, Horizontal Bar Graph, Vertical Bar Graph, and Column Bar Chart.
BPR Diagram. Business Process Reengineering Example
This sample was created in ConceptDraw DIAGRAM diagramming and vector drawing software using the Business Process Diagram Solution from the Business Processes area of ConceptDraw Solution Park. The Business Process Solution is based on the standard BPMN 2.0 and includes the set of libraries of ready-to-use objects.Functional Block Diagram
You need design the Functional Block Diagram and dream to find the useful tools to draw it easier, quickly and effectively? ConceptDraw DIAGRAM offers the Block Diagrams Solution from the "Diagrams" Area which will help you!The Best Drawing Program for Mac
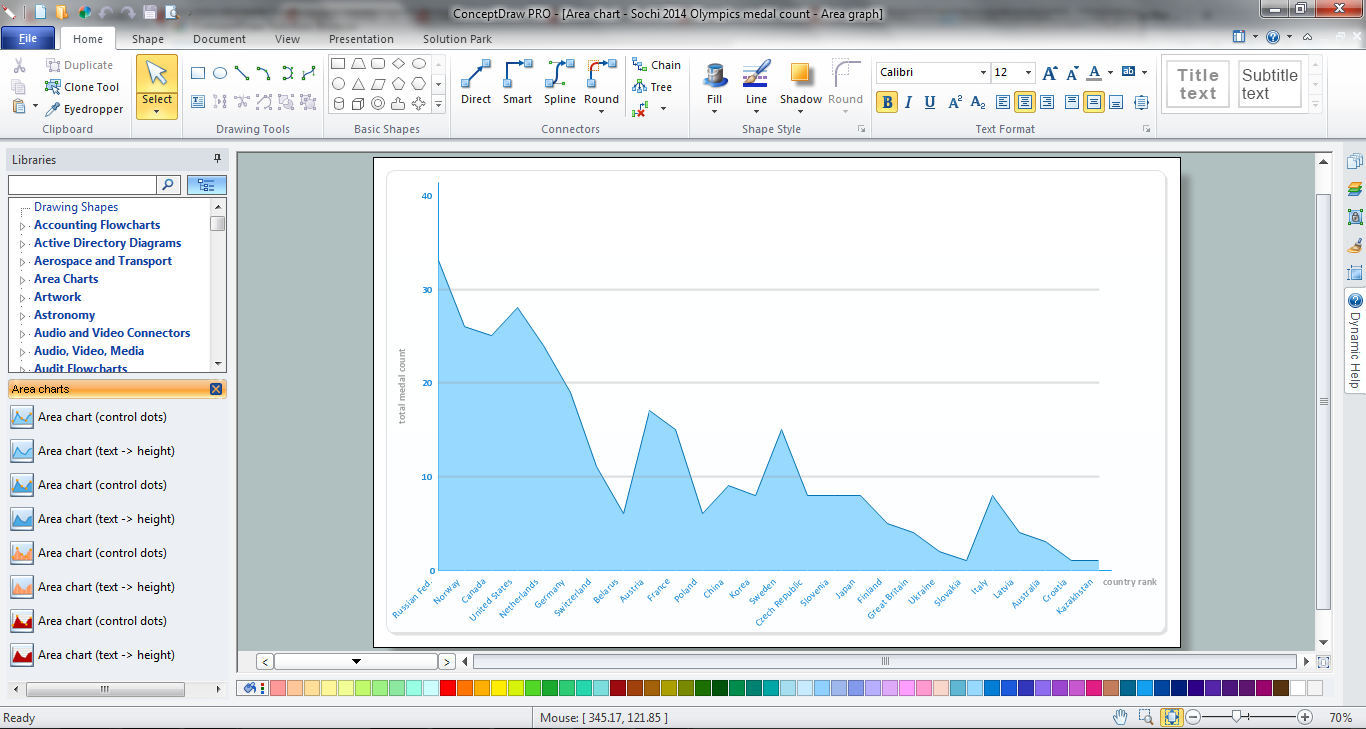
ConceptDraw DIAGRAM is the professional business graphic software for drawing diagrams and charts with great visual appeal on Mac OS X.Area Chart
ConceptDraw DIAGRAM diagramming and vector drawing software offers the Area Charts solution from the Graphs and Charts area of ConceptDraw Solution Park for quick and easy drawing the Area Chart of any complexity.
Graphs and Charts Area
Solutions from the Graphs and Charts Area of ConceptDraw Solution Park collect templates, samples and libraries of vector stencils for visualization of numerical data.
Best Diagramming Software for macOS
ConceptDraw DIAGRAM creates drawings, flowcharts, block diagrams, bar charts, histograms, pie charts, divided bar diagrams, line graphs, area charts, scatter plots, circular arrows diagrams, Venn diagrams, bubble diagrams with great visual appeal on Mac OS X.
Swim Lane Diagrams
Swim Lane diagrams are the variety of process flow diagrams and are based on the IDEF3 standard. They were developed by Lynn Shostack for usage in projecting. With their help organization diagrams are combined with process flow, as they visually display an object of the production system which is charged with given concrete processes in general flow of processes of the production system.Local area network (LAN). Computer and Network Examples
A local area network (LAN) is a devices network that connect with each other in the scope of a home, school, laboratory, or office. Usually, a LAN comprise computers and peripheral devices linked to a local domain server. All network appliances can use a shared printers or disk storage. A local area network serve for many hundreds of users. Typically, LAN includes many wires and cables that demand a previously designed network diagram. They are used by IT professionals to visually document the LANs physical structure and arrangement.ConceptDraw - Perfect Network Diagramming Software with examples of LAN Diagrams. ConceptDraw Network Diagram is ideal for network engineers and network designers who need to draw Local Area Network diagrams.

Pareto Chart
This sample shows the Pareto Chart of titanium investment casting defects. On the Pareto chart at the same time are displayed a bar graph and a line graph. The descending values are represented by the bars and the cumulative total values are represented by the line. Pareto charts are widely used in the areas of the quality improvement and the time management.Competitor Analysis
Competitor analysis is a first and obligatory step in elaboration the proper corporate marketing strategy and creating sustainable competitive advantage. Use powerful opportunities of numerous solutions from ConceptDraw Solution Park for designing illustrative diagrams, charts, matrices which are necessary for effective competitor analysis.Feature Comparison Chart Software
An example of marketing analysis diagram, can be used to analyse product market and define marketing strategy.This sample shows the Feature Comparison Chart of the digital scouting cameras. It can be useful for digital cameras production field, marketing, sales, etc.
- A Picture Of A Block Graph
- Picture Graphs | Bar Graph | Chart Maker for Presentations | Pictures ...
- Image Of Block Graph
- Picture Of A Block Graph
- Bar Graphs | Sales Growth. Bar Graphs Example | Picture Graphs ...
- Chart Maker for Presentations | Basic Diagramming | Bar Graph ...
- Basic Diagramming | Chart Maker for Presentations | Bar Graph ...
- Block Diagrams Images Easy
- Rainfall Bar Chart | Picture Graph | Bar Graph | Image Bar Graph
- Block Graph Template
- Picture Graph | Picture Graphs | How to Create a Picture Graph in ...
- Basic Diagramming | Basic Area Charts | Picture Graphs | Block ...
- Image For Bar Graph
- What Is a Picture Graph ? | How to Create Presentation of Your ...
- Block Diagram Pictures
- Bar Diagram Of Monthly Rainfall Image In Bar Graph
- Simple Bar Daigram Image
- Business Graphs And Charts Examples Image
- Basic Diagramming | What Is a Picture Graph ? | Basic Diagramming ...
- Population Of Environment Bar Graphs Images
- ERD | Entity Relationship Diagrams, ERD Software for Mac and Win
- Flowchart | Basic Flowchart Symbols and Meaning
- Flowchart | Flowchart Design - Symbols, Shapes, Stencils and Icons
- Flowchart | Flow Chart Symbols
- Electrical | Electrical Drawing - Wiring and Circuits Schematics
- Flowchart | Common Flowchart Symbols