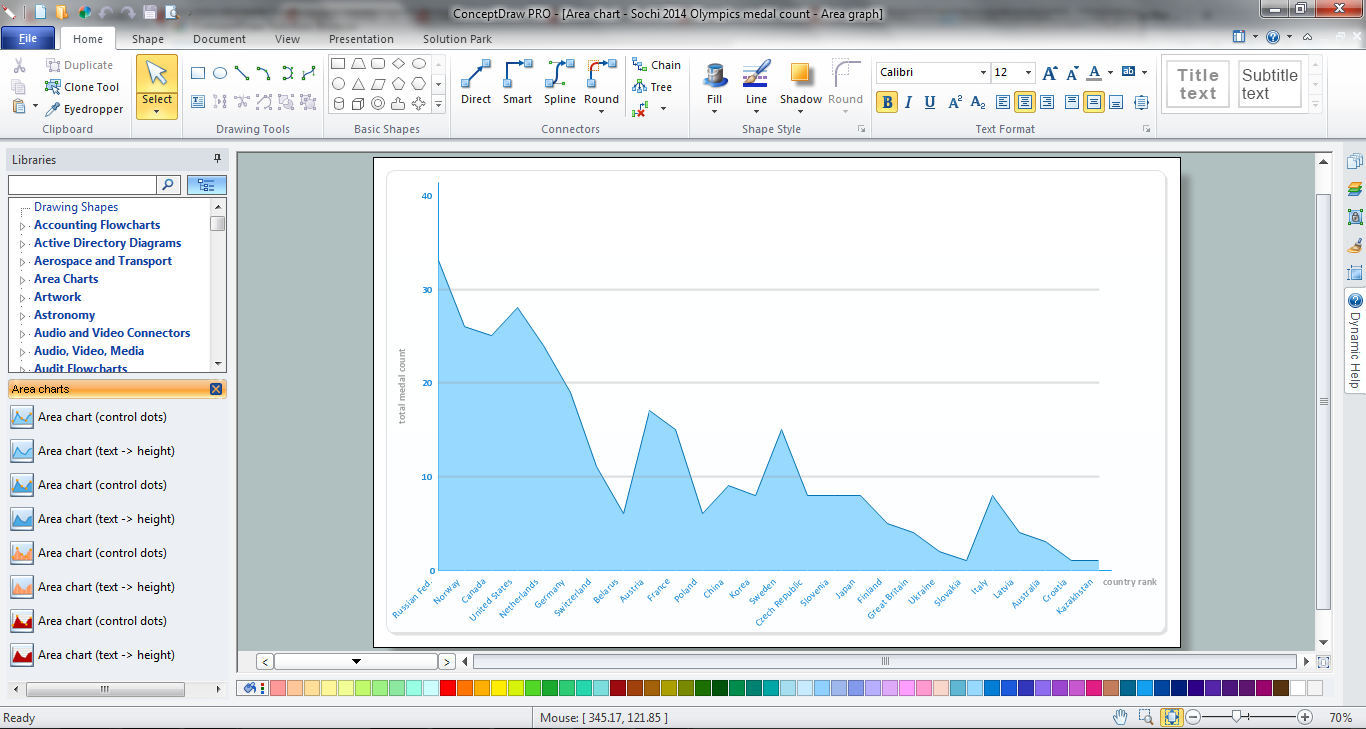
Example 1. Area Chart in ConceptDraw DIAGRAM
How is it easy create the Area Chart in ConceptDraw DIAGRAM Just a few movements - drag the predesigned graph object from the Area Charts library to your document and simply set your values. And professional looking, visual and clear Area Chart will be completed.

Example 2. Area Charts Library — Design Elements
Area Charts Solution provides also wide variety of templates and samples of professional looking Area Charts. They are represented in ConceptDraw STORE.

Example 3. Area Charts Solution in ConceptDraw STORE
You can choose the any favourite Area Chart from the ConceptDraw STORE. All they are available for opening, viewing and editing.

Example 3. Area Chart — San Francisco CA Population Growth
This Area Chart was created in ConceptDraw DIAGRAM using the Area Charts solution from Graphs and Charts area and shows how a population in San Francisco grew over the time. An experienced user spent 15 minutes creating this sample.
The Area Chart designed with ConceptDraw DIAGRAM is vector graphic documents and is available for reviewing, modifying, converting to a variety of formats (image, HTML, PDF file, MS PowerPoint Presentation, Adobe Flash or MS Visio), printing and send via e-mail in one moment.
EIGHT RELATED HOW TO's:
Looking for the line graph examples you can simply go to the Line Graphs solution of ConceptDraw STORE to get those which were previously created especially for the ConceptDraw DIAGRAM users in order to simplify their work of making such charts.
Picture: Line Graph
Related Solution:
In your work activity you need regularly draw the line graphs? And each time you ask yourself a question How to Draw a Line Graph easier and faster?. The desire to automate the line graphs drawing process led to the creation of Line Graphs solution from Graphs and Charts area of ConceptDraw Solution Park.
Picture: How to Draw a Line Graph
Related Solution:
ConceptDraw DIAGRAM extended with Divided Bar Diagrams solution from Graphs and Charts area of ConceptDraw Solution Park is the best software for quick and simple drawing the Divided Bar Diagrams and Bar Diagram Math.
Picture: Bar Diagram Math
Related Solution:
ConceptDraw DIAGRAM diagramming and vector drawing software extended with Mathematics solution from the Science and Education area is the best for creating: mathematical diagrams, graphics, tape diagrams various mathematical illustrations of any complexity quick and easy.
Mathematics solution provides 3 libraries: Plane Geometry Library, Solid Geometry Library, Trigonometric Functions Library.
Picture: Mathematical Diagrams
Related Solution:
The Total Quality Management Diagram solution helps you and your organization visualize business and industrial processes. Create Total Quality Management diagrams for business process with ConceptDraw software.
Picture: TQM Diagram Example
Related Solution:
The Nature Solution addition to ConceptDraw Solution Park for ConceptDraw DIAGRAM includes new libraries that provide a wide range nature objects and it can be used to augment documentation and graphics. Draw beautiful nature scenes using ConceptDraw DIAGRAM software with Nature solution.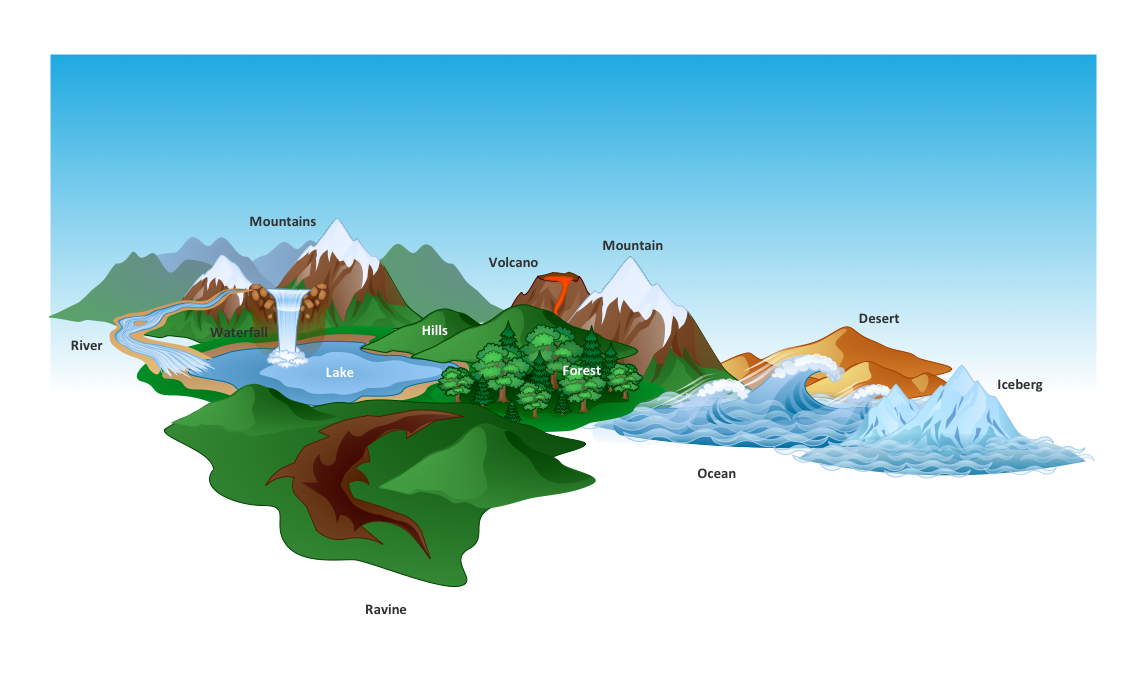
Picture: Beautiful Nature Scene: Drawing
To make a histogram, you need to divide the range of values into a series of intervals and then to count how many of the values fall into each of the intervals.
Picture: Histogram
Related Solution:
A list of parameters on which networks differ is very long. A large network with a range up to 50 kilometers is called metropolitan area network (MAN), and this type of network can include several local area networks. Metropolitan networks in their turn connect into global area networks.
Here you will see a Metropolitan Area Network (MAN). This is an extensive network which occupies a large territory including a few buildings or even the whole city. The space of the MAN is bigger than LAN, but lower than WAN. MAN comprise a lot of communication equipment and delivers the Internet connection to the LANs in the city area. Computer and Networks solution for ConceptDraw DIAGRAM provides a set of libraries with ready-to-use vector objects to design various kinds of computer networks.
Picture: Metropolitan area networks (MAN). Computer and Network Examples
Related Solution:


