Chart Examples

The vector stencils library "Education charts" contains 12 graphs and charts: area chart, column chart, divided bar diagram, histogram, horizontal bar graph, line graph, pie chart, ring chart, scatter plot.
Use it to create your education infogram in the ConceptDraw PRO diagramming and vector drawing software.
The vector stencils library "Education charts" is included in the Education Infographics solution from the Business Infographics area of ConceptDraw Solution Park.
Use it to create your education infogram in the ConceptDraw PRO diagramming and vector drawing software.
The vector stencils library "Education charts" is included in the Education Infographics solution from the Business Infographics area of ConceptDraw Solution Park.
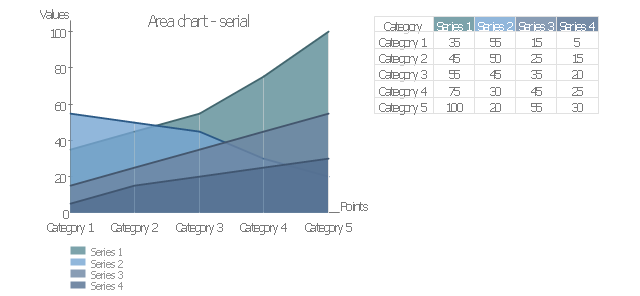
Area chart - serial

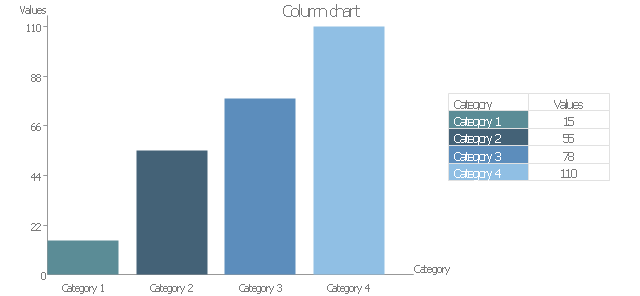
Column chart

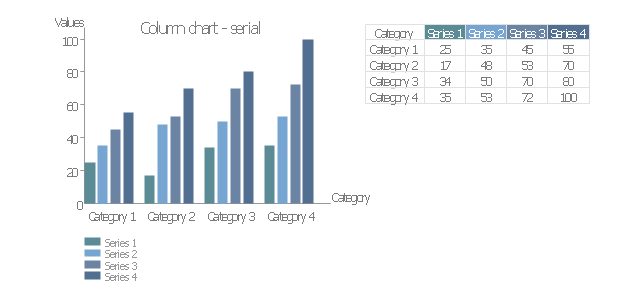
Column chart - serial

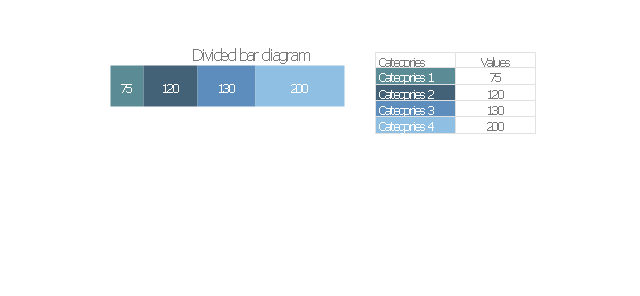
Divided bar diagram

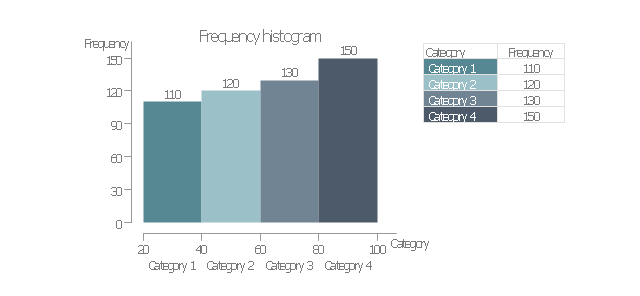
Frequency histogram

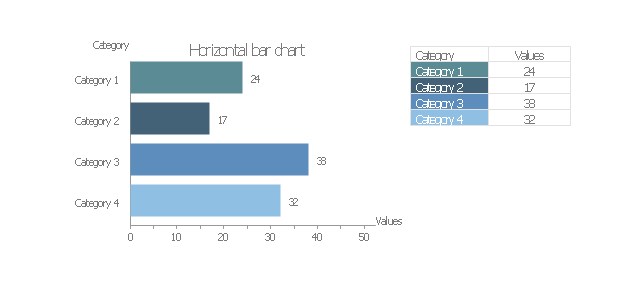
Horizontal bar chart

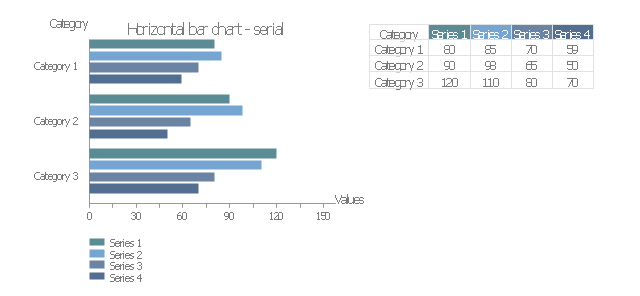
Horizontal bar chart - serial

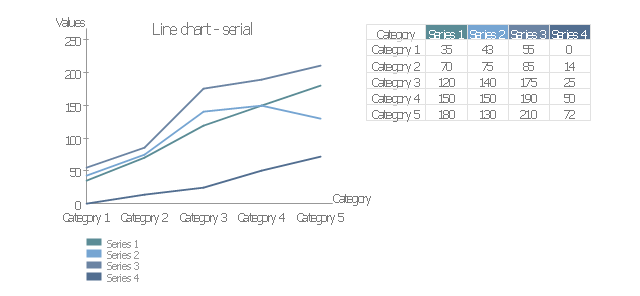
Line chart - serial

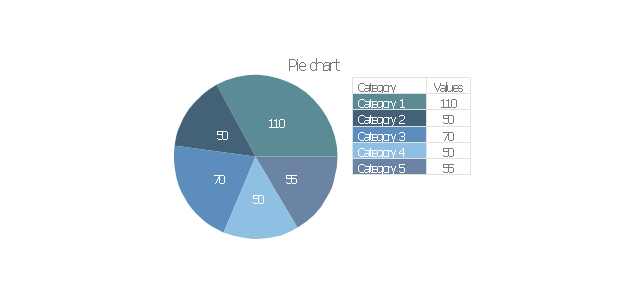
Pie chart

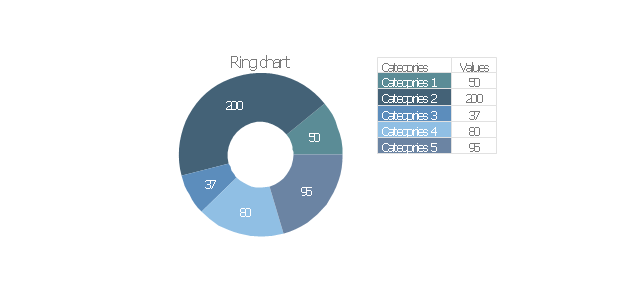
Ring chart

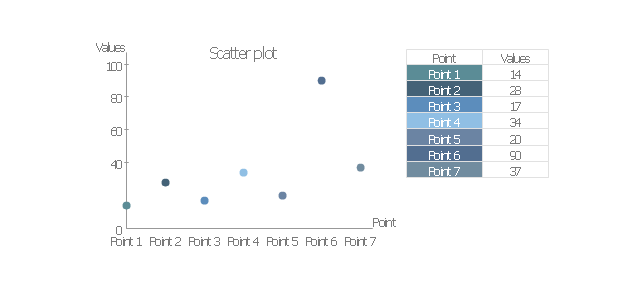
Scatter plot

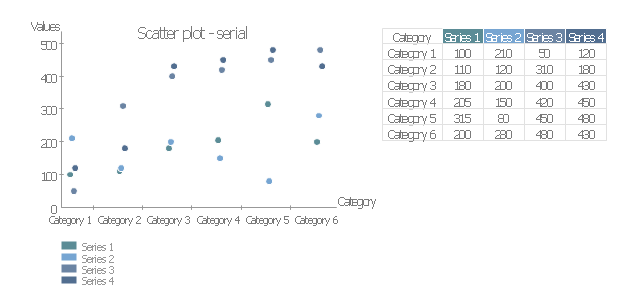
Scatter plot - serial

The vector stencils library "Data-driven charts" contains 13 data-driven graphs and charts: area chart, divided bar diagram, double bar graph, frequency histogram, horizontal bar chart, line graph, percentage ring chart, percentage pie chart, scatter plot, column chart, waterfall chart.
Use it to visualize quantitative data in your data-driven infographics.
The graphs example "Data-driven charts - Vector stencils library" was created using the ConceptDraw PRO diagramming and vector graphics software extended with the Data-driven Infographics solution from the area "What is infographics" of ConceptDraw Solution Park.
Area chart

Divided bar diagram

Double bar graph

Frequency histogram

Horizontal bar graph

Line graph

Percentage ring chart

Pie chart

Percentage pie chart

Ring chart

Scatter plot

Column chart (vertical bar graph)
-data-driven-charts---vector-stencils-library.png--diagram-flowchart-example.png)
Waterfall chart

Histogram

Making a Histogram

 Basic Histograms
This solution extends the capabilities of ConceptDraw DIAGRAM (or later) with templates, samples and a library of vector stencils for drawing Histograms.
How Do You Make a Histogram?

How To Make Histogram in ConceptDraw DIAGRAM ?

The vector stencils library "Management charts" contains 12 graphs and charts: area chart, column chart, divided bar diagram, histogram, horizontal bar graph, line graph, pie chart, ring chart, scatter plot.
Use it to create your management infogram in the ConceptDraw PRO diagramming and vector drawing software.
The graphs example "Management charts - Vector stencils library" is included in the solution "Marketing infographics" from the "Business infographics" area of ConceptDraw Solution Park.
Use it to create your management infogram in the ConceptDraw PRO diagramming and vector drawing software.
The graphs example "Management charts - Vector stencils library" is included in the solution "Marketing infographics" from the "Business infographics" area of ConceptDraw Solution Park.
Area chart - serial
Column chart
Column chart - serial
Divided bar diagram
Frequency histogram
Horizontal bar chart
Horizontal bar chart - serial
Line chart - serial
Pie chart
Ring chart
Scatter plot
Scatter plot - serial
HelpDesk
How to Draw a Histogram

Scatter Plot Graph

 Education Package
Education Package is a comprehensive set of multifarious graphical solutions from ConceptDraw Solution Park, collected together in help to ConceptDraw DIAGRAM users working in a field of science, education and training, which is aimed at improving the quality of education and helping to design with ease variety of interesting and colorful educational materials, diagrams, charts and maps. Use it to present the information and knowledge in an interesting, clear, structured and simple form to achieve a success in education and pedagogy, to maintain the interest of students and pupils throughout the whole learning process, at the lectures, lessons and even during independent work with additional materials, to contribute to better perception of scientific information by listeners during the conferences and reports.
Seven Basic Tools of Quality - Histogram

 Histograms
How to make a Histogram? Making a Histogram is an incredibly easy process when it is done with ConceptDraw DIAGRAM. The Histograms Solution enhances ConceptDraw DIAGRAM functionality with extensive drawing tools, numerous samples, and examples; also a quick-start template and library of ready vector stencils for visualization the data and professional drawing Histograms.
The vector stencils library "Marketing charts" contains 12 graphs and charts: area chart, column chart, divided bar diagram, histogram, horizontal bar graph, line graph, pie chart, ring chart, scatter plot.
Use it to create your marketing infograms.
"A chart can take a large variety of forms, however there are common features that provide the chart with its ability to extract meaning from data.
Typically the data in a chart is represented graphically, since humans are generally able to infer meaning from pictures quicker than from text. Text is generally used only to annotate the data.
One of the more important uses of text in a graph is the title. A graph's title usually appears above the main graphic and provides a succinct description of what the data in the graph refers to.
Dimensions in the data are often displayed on axes. If a horizontal and a vertical axis are used, they are usually referred to as the x-axis and y-axis respectively. Each axis will have a scale, denoted by periodic graduations and usually accompanied by numerical or categorical indications. Each axis will typically also have a label displayed outside or beside it, briefly describing the dimension represented. If the scale is numerical, the label will often be suffixed with the unit of that scale in parentheses. ...
The data of a chart can appear in all manner of formats, and may include individual textual labels describing the datum associated with the indicated position in the chart. The data may appear as dots or shapes, connected or unconnected, and in any combination of colors and patterns. Inferences or points of interest can be overlaid directly on the graph to further aid information extraction.
When the data appearing in a chart contains multiple variables, the chart may include a legend (also known as a key). A legend contains a list of the variables appearing in the chart and an example of their appearance. This information allows the data from each variable to be identified in the chart." [Chart. Wikipedia]
The shapes example "Design elements - Marketing charts" was created using the ConceptDraw PRO diagramming and vector drawing software extended with the Marketing Infographics solition from the area "Business Infographics" in ConceptDraw Solution Park.
Graphs and charts

Step Area Graph

Line Chart Template for Word

This projects HR dashboard example includes the histogram of employees distribution by salary, the area chart of salari distribution, and two horizontal bar charts: "Employees by Project Teams" and "Payroll Breakdown".
"Project Portfolio Management (PPM) is the centralized management of processes, methods, and technologies used by project managers and project management offices (PMOs) to analyze and collectively manage a group of current or proposed projects based on numerous key characteristics. The objectives of PPM are to determine the optimal resource mix for delivery and to schedule activities to best achieve an organization’s operational and financial goals ― while honouring constraints imposed by customers, strategic objectives, or external real-world factors. ... With PPM, the Office of Finance can improve their accuracy for estimating and managing the financial resources of a project or group of projects. In addition, the value of projects can be demonstrated in relation to the strategic objectives and priorities of the organization through financial controls and to assess progress through earned value and other project financial techniques." [Project portfolio management. Wikipedia]
The example "Projects HR dashboard" was created using the ConceptDraw PRO diagramming and vector drawing software extended with the Frequency Distribution Dashboard solution from the area "What is a Dashboard" of ConceptDraw Solution Park.
Visual dashboard

 Business Diagrams Package
Business Diagrams Package is a large set of comprehensive graphical solutions from the ConceptDraw Solution Park, which are powerful in solving the business, marketing and quality tasks in completely different fields, such as finance, education, health food and cooking, HR, and many others. The tools of this package's solutions are a powerful assistant in drawing all diversity of Financial and Marketing infographics, Business process workflow diagrams, Organizational charts, Education infographics, Quality diagrams, Health food diagrams, HR flowcharts, as well as different graphics and charts, which depict the values of key business indicators, their dependencies, give the full understanding of a situation within a company and on the market.
Histogram Chart

- Bar Graph | Bar Chart Software | Chart Maker for Presentations ...
- Bar Graphs | Basic Histograms | Chemistry | Amino Acid Analysis ...
- Bar Graphs | Histogram Chart | Chemistry | Amino Acids Diagram
- Amino acid composition of complete UniProt database | Bar Graphs ...
- Bar Chart | Bar Graph | How to Draw a Histogram | Bar Graphs Vs ...
- Histograms - Vector stencils library | Frequency distribution charts ...
- Histograms | Chart Examples | Bar Chart | Histogram Languages ...
- How To Draw A Compound Bar Graph And A Histogram
- Diagrams Of Histogram And Bar Chart
- Amino acid composition of complete UniProt database | Histogram ...
- Bar Chart , Column Chart , Pie Chart , Spider chart , Venn Chart , Line ...
- Histogram Chart | Seven Basic Tools of Quality - Histogram | How to ...
- Histogram Graph And Decision Making
- How to Draw a Divided Bar Chart in ConceptDraw PRO | Basic ...
- Histogram Chart | Make a Histogram | Histograms | What Is A ...
- Chart Maker for Presentations | Serious crime in Cincinnati | Column ...
- Amino acid length distribution - Histogram | Histogram Chart | How ...
- Histograms | Basic Histograms | Chart Examples | Histogram Of ...
- Page load time - Frequency histogram | Histogram Chart | Make a ...