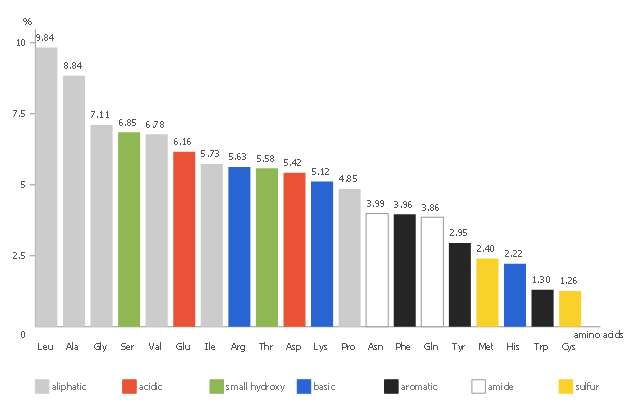
This vertical bar chart sample shows the amino acid composition in percent for the complete UniProtKB/ TrEMBL protein database release 2016_ 07. It was designed using statistic data from the website of UniProt protein sequence database. [ebi.ac.uk/ uniprot/ TrEMBLstats]
"The mission of UniProt is to provide the scientific community with a comprehensive, high quality and freely accessible resource of protein sequence and functional information." [ebi.ac.uk/ uniprot]
The column chart example "Amino acid composition of complete UniProt database" was created using the ConceptDraw PRO diagramming and vector drawing software extended with the Bar Graphs solution from the Graphs and Charts area of ConceptDraw Solution Park.
Column chart
Histogram Chart

 Bar Graphs
The Bar Graphs solution enhances ConceptDraw DIAGRAM functionality with templates, numerous professional-looking samples, and a library of vector stencils for drawing different types of Bar Graphs, such as Simple Bar Graph, Double Bar Graph, Divided Bar Graph, Horizontal Bar Graph, Vertical Bar Graph, and Column Bar Chart.
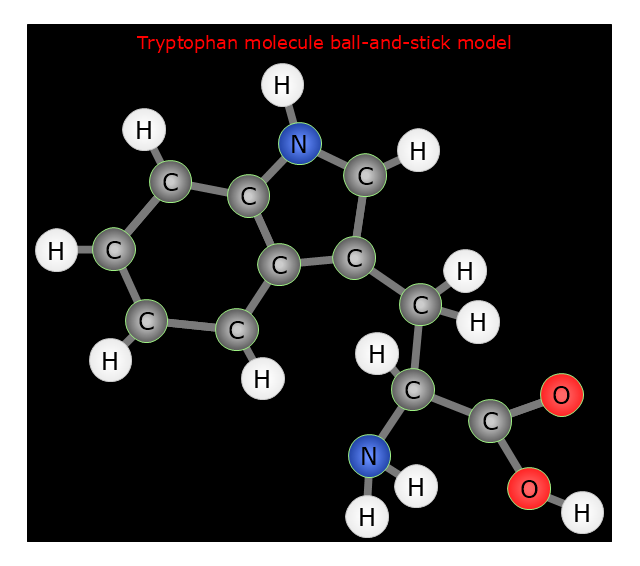
"Tryptophan (IUPAC-IUBMB abbreviation: Trp or W; IUPAC abbreviation: L-Trp or D-Trp; sold for medical use as Tryptan) is one of the 22 standard amino acids and an essential amino acid in the human diet, as demonstrated by its growth effects on rats. It is encoded in the standard genetic code as the codon UGG. Only the L-stereoisomer of tryptophan is used in structural or enzyme proteins, but the R -stereoisomer is occasionally found in naturally produced peptides (for example, the marine venom peptide contryphan). The distinguishing structural characteristic of tryptophan is that it contains an indole functional group." [Tryptophan. Wikipedia]
The chemical drawing example "Tryptophan molecule ball-and-stick model" was created using the ConceptDraw PRO software extended with the Chemistry solution from the Science and Education area of ConceptDraw Solution Park.
The chemical drawing example "Tryptophan molecule ball-and-stick model" was created using the ConceptDraw PRO software extended with the Chemistry solution from the Science and Education area of ConceptDraw Solution Park.
Tryptophan amino acid
How To Make a Histogram?

The vector stencils library "Citric acid cycle (TCA cycle)" contains 26 symbols of metabolites for drawing metabolic pathway maps and biochemical shematic diagrams of the citric acid cycle (TCA cycle, tricarboxylic acid cycle, Krebs cycle) and diagrams of metabolism processes.
"The citric acid cycle - also known as the tricarboxylic acid cycle (TCA cycle), or the Krebs cycle, - is a series of chemical reactions used by all aerobic organisms to generate energy through the oxidation of acetate derived from carbohydrates, fats and proteins into carbon dioxide and chemical energy in the form of adenosine triphosphate (ATP). In addition, the cycle provides precursors of certain amino acids as well as the reducing agent NADH that is used in numerous other biochemical reactions. Its central importance to many biochemical pathways suggests that it was one of the earliest established components of cellular metabolism and may have originated abiogenically.
The name of this metabolic pathway is derived from citric acid (a type of tricarboxylic acid) that is consumed and then regenerated by this sequence of reactions to complete the cycle. In addition, the cycle consumes acetate (in the form of acetyl-CoA) and water, reduces NAD+ to NADH, and produces carbon dioxide as a waste byproduct. The NADH generated by the TCA cycle is fed into the oxidative phosphorylation (electron transport) pathway. The net result of these two closely linked pathways is the oxidation of nutrients to produce usable chemical energy in the form of ATP." [Citric acid cycle. Wikipedia]
The shapes example "Design elements - TCA cycle" is included in the Biology solution from the Science and Education area of ConceptDraw Solution Park.
Tricarboxylic acid cycle (Krebs cycle) symbols
-symbols--design-elements---tca-cycle.png--diagram-flowchart-example.png)
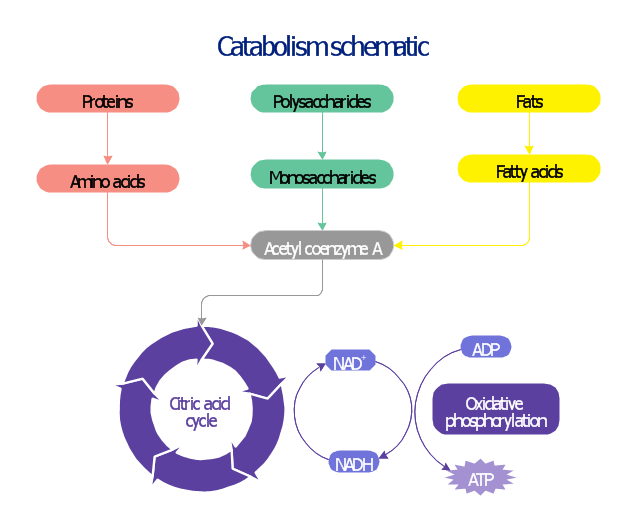
This biochemical chart display how proteins, polysaccharides and fats from food are digested into gastrointestinal tract into aminoacids, monosaccharides and fatty acids, and then broken down and oxidized to carbon dioxide and water in cellular processes of energy generation.
This metabolic pathway map was redesigned from Wikipedia file: Catabolism schematic.svg. [en.wikipedia.org/ wiki/ File:Catabolism_ schematic.svg]
The biochemical diagram example "Catabolism schematic" was created using the ConceptDraw PRO diagramming and vector drawing software extended with the Biology solution from the Science and Education area of ConceptDraw Solution Park.
Catabolic pathway map
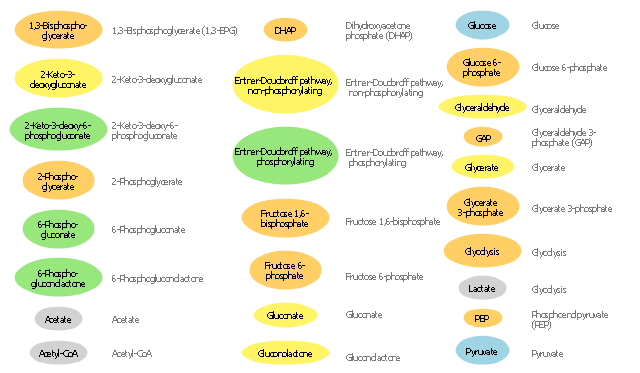
The vector stencils library "Carbohydrate metabolism" contains 25 icons of metabolite symbols.
Use these shapes for drawing carbohydrate metabolism schematics, biochemical diagrams and metabolic pathways maps.
"Carbohydrates are a superior short-term fuel for organisms because they are simpler to metabolize than fats or those amino acids (components of proteins) that can be used for fuel. In animals, the most important carbohydrate is glucose. The concentration of glucose in the blood is used as the main control for the central metabolic hormone, insulin. Starch, and cellulose in a few organisms (e.g., some animals ... and ... microorganisms), both being glucose polymers, are disassembled during digestion and absorbed as glucose. Some simple carbohydrates have their own enzymatic oxidation pathways, as do only a few of the more complex carbohydrates. The disaccharide lactose, for instance, requires the enzyme lactase to be broken into its monosaccharides components; many animals lack this enzyme in adulthood." [Carbohydrate metabolism. Wikipedia]
The shapes example "Design elements - Carbohydrate metabolism" is included in the Biology solution from the Science and Education area of ConceptDraw Solution Park.
Carbohydrate metabolite symbols
 Chemistry
This solution extends ConceptDraw DIAGRAM software with samples, template and libraries of vector stencils for drawing the Chemistry Illustrations for science and education.
 Basic Histograms
This solution extends the capabilities of ConceptDraw DIAGRAM (or later) with templates, samples and a library of vector stencils for drawing Histograms.
This process flow diagram (PFD) example shows an amine treating system for the removal of gaseous hydrogen sulfide from gas streams. It is used in oil refineries and chemical plants. This PFD sample was redesigned from the Wikimedia Commons file: AmineTreating.png. [commons.wikimedia.org/ wiki/ File:AmineTreating.png]
This file is licensed under the Creative Commons Attribution-Share Alike 3.0 Unported license. [creativecommons.org/ licenses/ by-sa/ 3.0/ deed.en]
"Amine gas treating, also known as gas sweetening and acid gas removal, refers to a group of processes that use aqueous solutions of various alkylamines (commonly referred to simply as amines) to remove hydrogen sulfide (H2S) and carbon dioxide (CO2) from gases. It is a common unit process used in refineries, and is also used in petrochemical plants, natural gas processing plants and other industries.
Processes within oil refineries or chemical processing plants that remove hydrogen sulfide are referred to as "sweetening" processes because the odor of the processed products is improved by the absence of hydrogen sulfide. An alternative to the use of amines involves membrane technology. Membranes are attractive since no reagents are consumed.
Many different amines are used in gas treating:
Diethanolamine (DEA),
Monoethanolamine (MEA),
Methyldiethanolamine (MDEA),
Diisopropanolamine (DIPA),
Aminoethoxyethanol (Diglycolamine) (DGA).
The most commonly used amines in industrial plants are the alkanolamines DEA, MEA, and MDEA. These amines are also used in many oil refineries to remove sour gases from liquid hydrocarbons such as liquified petroleum gas (LPG)." [Amine gas treating. Wikipedia]
The PFD example "Amine treating unit schematic diagram" was drawn using the ConceptDraw PRO diagramming and vector drawing software extended with the Chemical and Process Engineering solution from the Chemical and Process Engineering area of ConceptDraw Solution Park.
Process Flow Diagram (PFD)
-amine-treating-unit-schematic-diagram.png--diagram-flowchart-example.png)
Histogram

 Histograms
How to make a Histogram? Making a Histogram is an incredibly easy process when it is done with ConceptDraw DIAGRAM. The Histograms Solution enhances ConceptDraw DIAGRAM functionality with extensive drawing tools, numerous samples, and examples; also a quick-start template and library of ready vector stencils for visualization the data and professional drawing Histograms.
Business Diagram Software


How to Make SWOT Analysis in a Word Document

- Amino Acids Chart
- Amino Acid Bar Chart
- Design elements - TCA cycle | Metabolism Of Fat With Flow Chart
- Kreb Cycle Flow Chart
- Percentage Pie Chart . Pie Chart Examples | Pie Chart Examples ...
- Methabolic Pathway Chart
- Circle Spoke Diagram Template | Pie Chart Examples and ...
- 3D Column chart - Iran internet users per 100 person | Column Chart ...
- Acid Drawings
- How to Draw a Histogram in ConceptDraw PRO | Seven Basic Tools ...
- Design elements - Biochemistry of metabolism | Flow Chart Of ...
- Design elements - TCA cycle | Citric acid cycle (TCA cycle) | Biology ...
- Images Of Pictograph And Line Graph And Pie Chart With Named Only
- Biology | Basic Flowchart Symbols and Meaning | Biology Illustration ...
- Carbohydrates Metabolism Flow Chart
- Bar Graph | Column Chart Software | Bar Chart Software | In A Bar ...
- Bar Graphs | Column Chart Examples | Column Chart Template | Bar ...
- Metabolic pathway map - Biochemical diagram | Biology ...
- Design elements - Biochemistry of metabolism | Biology | Basic ...
- Double bar chart - Nitrate concentration in Community Water ...