The vector stencils library "Histograms" contains 8 templates of histograms for visualizing frequency distribution data.
Drag a template from the library to your document and enter your data.
Use these shapes to draw your histograms in ConceptDraw PRO diagramming and vector drawing software.
The vector stencils library "Histograms" is included in the Histograms solution from the Graphs and Charts area of ConceptDraw Solution Park.
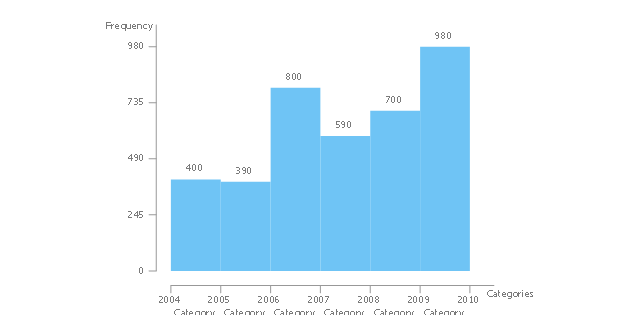
Frequency histogram
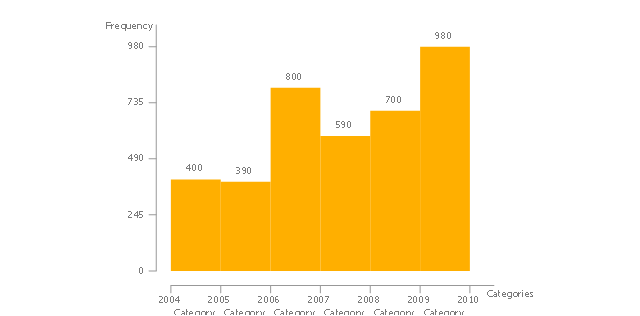
Frequency histogram 2
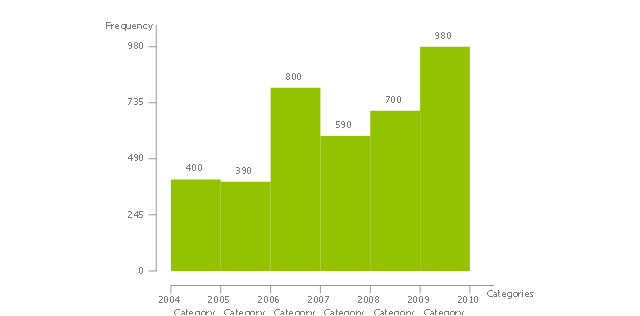
Frequency histogram 3
Frequency histogram (table)
-histograms---vector-stencils-library.png--diagram-flowchart-example.png)
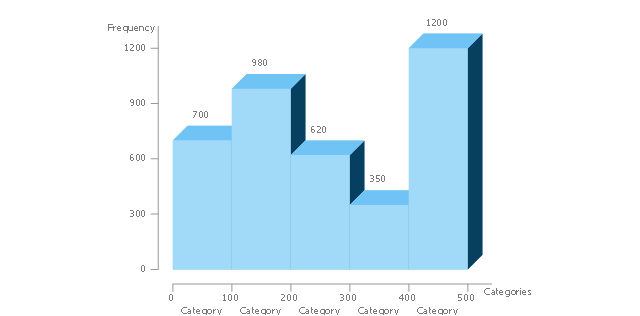
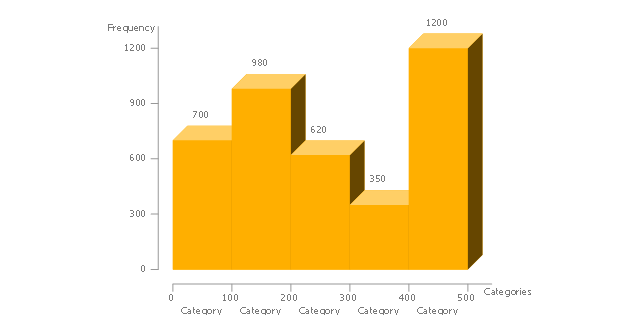
3D frequency histogram
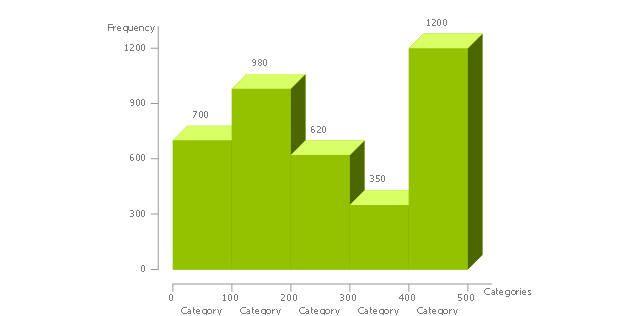
3D frequency histogram 2
3D frequency histogram 3
3D frequency histogram (table)
-histograms---vector-stencils-library.png--diagram-flowchart-example.png)
The vector stencils library "Frequency distribution charts" contains 2 area chart templates and 2 histogram templates.
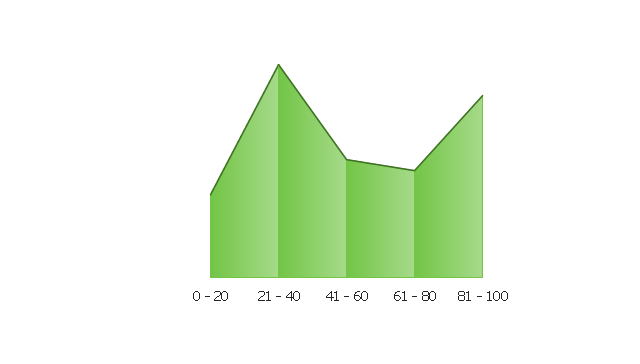
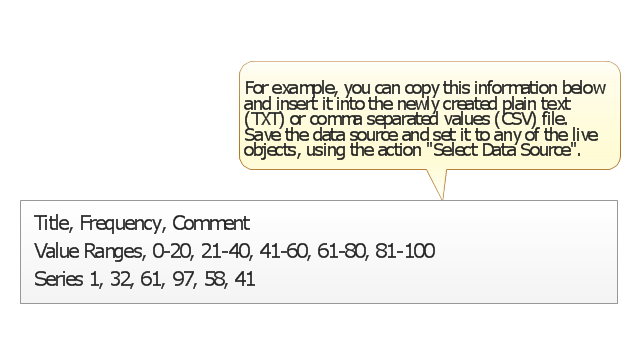
Frequency distribution charts are Live Objects which show the distribution of items within numerical ranges.
Use this library for drawing visual dashboards in the ConceptDraw PRO diagramming and vector drawing software extended with the Frequency Distribution Dashboard solution from the area "What is a Dashboard" of ConceptDraw Solution Park.
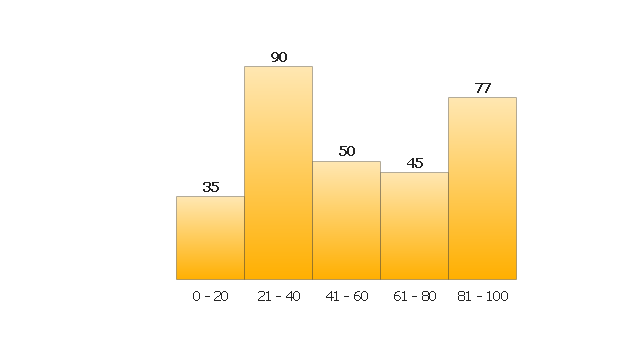
Histogram 1

Histogram 2
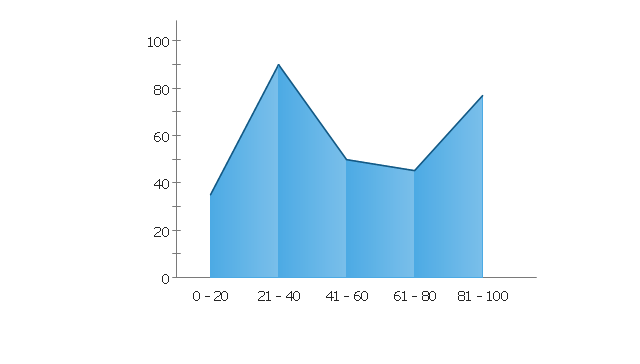
Area Chart 1
Area Chart 2
Data Source File Example
Histogram Chart

The vector stencils library "Education charts" contains 12 graphs and charts: area chart, column chart, divided bar diagram, histogram, horizontal bar graph, line graph, pie chart, ring chart, scatter plot.
Use it to create your education infogram in the ConceptDraw PRO diagramming and vector drawing software.
The vector stencils library "Education charts" is included in the Education Infographics solution from the Business Infographics area of ConceptDraw Solution Park.
Use it to create your education infogram in the ConceptDraw PRO diagramming and vector drawing software.
The vector stencils library "Education charts" is included in the Education Infographics solution from the Business Infographics area of ConceptDraw Solution Park.
Area chart - serial

Column chart

Column chart - serial

Divided bar diagram

Frequency histogram

Horizontal bar chart

Horizontal bar chart - serial

Line chart - serial

Pie chart

Ring chart

Scatter plot

Scatter plot - serial

 Basic Histograms
This solution extends the capabilities of ConceptDraw DIAGRAM (or later) with templates, samples and a library of vector stencils for drawing Histograms.
The vector stencils library "Data-driven charts" contains 13 data-driven graphs and charts: area chart, divided bar diagram, double bar graph, frequency histogram, horizontal bar chart, line graph, percentage ring chart, percentage pie chart, scatter plot, column chart, waterfall chart.
Use it to visualize quantitative data in your data-driven infographics.
The graphs example "Data-driven charts - Vector stencils library" was created using the ConceptDraw PRO diagramming and vector graphics software extended with the Data-driven Infographics solution from the area "What is infographics" of ConceptDraw Solution Park.
Area chart

Divided bar diagram

Double bar graph

Frequency histogram

Horizontal bar graph

Line graph

Percentage ring chart

Pie chart

Percentage pie chart

Ring chart

Scatter plot

Column chart (vertical bar graph)
-data-driven-charts---vector-stencils-library.png--diagram-flowchart-example.png)
Waterfall chart

 Histograms
How to make a Histogram? Making a Histogram is an incredibly easy process when it is done with ConceptDraw DIAGRAM. The Histograms Solution enhances ConceptDraw DIAGRAM functionality with extensive drawing tools, numerous samples, and examples; also a quick-start template and library of ready vector stencils for visualization the data and professional drawing Histograms.
HelpDesk
How to Draw a Histogram

Best Program to Make Diagrams


Best Vector Drawing Application for Mac OS X

Simple Diagramming


 Seven Basic Tools of Quality
Manage quality control in the workplace, using fishbone diagrams, flowcharts, Pareto charts and histograms, provided by the Seven Basic Tools of Quality solution.
Basic Diagramming


Examples of Flowcharts, Org Charts and More


- Histograms - Vector stencils library
- Histograms - Vector stencils library | Design elements - Histograms ...
- Histograms - Vector stencils library | Frequency distribution ...
- Histograms - Vector stencils library | How to Draw a Histogram in ...
- How to Draw a Histogram in ConceptDraw PRO | Histograms ...
- Food - Vector stencils library | Food | Histograms | Cherry Illustration ...
- Food - Vector stencils library | Histogram Chart | Make a Histogram ...
- Wind speed histogram | Resources and energy - Vector stencils ...
- Frequency distribution charts - Vector stencils library | Design ...
- Beetles in the river Thames | Geography - Vector stencils library ...
- How to Draw a Histogram in ConceptDraw PRO | Education charts ...
- Pyramid diagrams - Vector stencils library | Directional Maps ...
- Histogram Templates
- Beetles in the river Thames | Histogram Of Biodiversity
- Histograms | Histogram Chart | Basic Histograms | Histograms
- Histogram - Template | Normal distribution graph - Template | How ...
- Histograms | Basic Histograms | Histogram | Histograms Solution
- Design elements - Histogram
- Health Food | Histograms | Pie Charts | Pie Chart And Histogram For ...