Histogram Chart

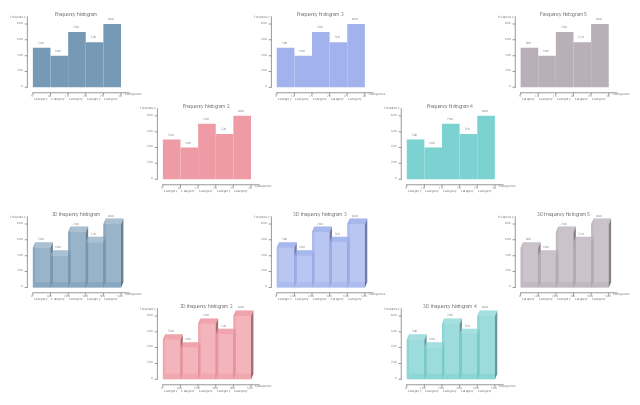
The vector stencils library "Histograms" contains 10 chart templates. Use it to design your histograms for visualizing frequency distribution data in ConceptDraw PRO diagramming and vector drawing software.
"In statistics, a histogram is a graphical representation of the distribution of data. It is an estimate of the probability distribution of a continuous variable...
A histogram is a representation of tabulated frequencies, shown as adjacent rectangles, erected over discrete intervals (bins), with an area equal to the frequency of the observations in the interval. The height of a rectangle is also equal to the frequency density of the interval, i.e., the frequency divided by the width of the interval. The total area of the histogram is equal to the number of data. A histogram may also be normalized displaying relative frequencies. It then shows the proportion of cases that fall into each of several categories, with the total area equaling 1. The categories are usually specified as consecutive, non-overlapping intervals of a variable. The categories (intervals) must be adjacent, and often are chosen to be of the same size. The rectangles of a histogram are drawn so that they touch each other to indicate that the original variable is continuous.
Histograms are used to plot the density of data, and often for density estimation: estimating the probability density function of the underlying variable. The total area of a histogram used for probability density is always normalized to 1." [Histogram. Wikipedia]
The chart templates example "Design elements - Histograms" is included in the Basic Histograms solution from the Graphs and Charts area of ConceptDraw Solution Park.
Chart templates
Seven Basic Tools of Quality - Histogram

How To Make a Histogram?

How Do You Make a Histogram?

 Histograms
How to make a Histogram? Making a Histogram is an incredibly easy process when it is done with ConceptDraw DIAGRAM. The Histograms Solution enhances ConceptDraw DIAGRAM functionality with extensive drawing tools, numerous samples, and examples; also a quick-start template and library of ready vector stencils for visualization the data and professional drawing Histograms.
 Basic Histograms
This solution extends the capabilities of ConceptDraw DIAGRAM (or later) with templates, samples and a library of vector stencils for drawing Histograms.
Make a Histogram

 Seven Basic Tools of Quality
Manage quality control in the workplace, using fishbone diagrams, flowcharts, Pareto charts and histograms, provided by the Seven Basic Tools of Quality solution.
Making a Histogram

- Histogram - Template | Normal distribution graph - Template ...
- Frequency distribution dashboard - Template | Histograms - Vector ...
- Frequency Distribution Dashboard | ConceptDraw Solution Park ...
- Histograms | Histogram Chart | How to Draw a Histogram in ...
- Block Diagrams | Histograms | Directional Maps | Restaurant Table ...
- How To Create Restaurant Floor Plan in Minutes | Histograms ...
- Seven Basic Tools of Quality - Histogram | Histograms | Basic ...
- Page load time - Frequency histogram | Histogram Chart | Make a ...
- How to Draw a Histogram in ConceptDraw PRO | Chart Examples ...