"Web performance optimization, WPO, or website optimization is the field of knowledge about increasing the speed in which web pages are downloaded and displayed on the user's web browser. ...
With the average internet speed now increasing globally, it's fitting for website administrators and "webmasters" to consider the time it takes for websites to render for the visitor.
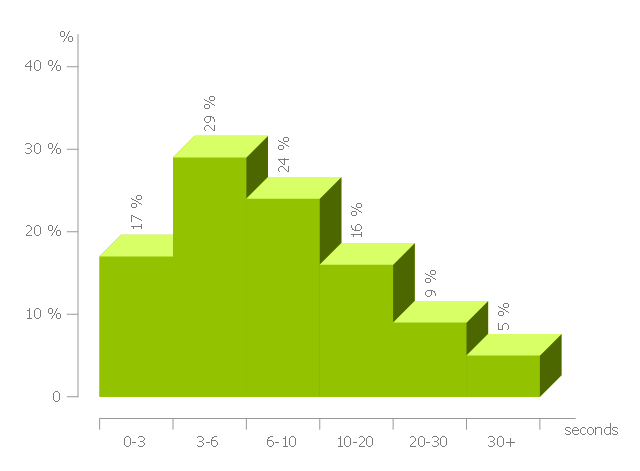
Faster website download speeds have been shown to increase visitor retention and loyalty and user satisfaction, especially for users with slow internet connections and those on mobile devices. Web performance also leads to less data travelling across the web, which in turn lowers a website's power consumption and environmental impact. Some aspects which can affect the speed of page load include Browser/ Server Cache, Image Optimization and also encryption (for example SSL), which can affect the time it takes for pages to render." [Web performance optimization. Wikipedia]
The histogram example "Page load time" was created using the ConceptDraw PRO diagramming and vector drawing software extended with the Histograms solution from the Graphs and Charts area of ConceptDraw Solution Park.
With the average internet speed now increasing globally, it's fitting for website administrators and "webmasters" to consider the time it takes for websites to render for the visitor.
Faster website download speeds have been shown to increase visitor retention and loyalty and user satisfaction, especially for users with slow internet connections and those on mobile devices. Web performance also leads to less data travelling across the web, which in turn lowers a website's power consumption and environmental impact. Some aspects which can affect the speed of page load include Browser/ Server Cache, Image Optimization and also encryption (for example SSL), which can affect the time it takes for pages to render." [Web performance optimization. Wikipedia]
The histogram example "Page load time" was created using the ConceptDraw PRO diagramming and vector drawing software extended with the Histograms solution from the Graphs and Charts area of ConceptDraw Solution Park.
Histogram
Histogram Chart

Make a Histogram

Pictures of Graphs

Chart Examples

HelpDesk
How to Draw a Histogram in ConceptDraw PRO

How To Make a Histogram?

Seven Basic Tools of Quality - Histogram

 Histograms
How to make a Histogram? Making a Histogram is an incredibly easy process when it is done with ConceptDraw PRO. The Histograms Solution enhances ConceptDraw PRO v10 functionality with extensive drawing tools, numerous samples, and examples; also a quick-start template and library of ready vector stencils for visualization the data and professional drawing Histograms.
Bar Diagram Math

 Mac OS X User Interface
Mac OS User Interface solution extends ConceptDraw PRO gui software with templates, samples and Mac OS user interface design examples, and large quantity of libraries with variety of vector stencils for designing the OS X 10.10 Yosemite user interfaces.
HelpDesk
How to Create Data-driven Infographics

 Seven Basic Tools of Quality
Manage quality control in the workplace, using fishbone diagrams, flowcharts, Pareto charts and histograms, provided by the Seven Basic Tools of Quality solution.
How to Create a Pyramid Diagram

Pie Chart Software

- Histograms | How to Draw a Histogram in ConceptDraw PRO | Page ...
- Page load time - Frequency histogram | Beetles in the river Thames ...
- Page load time - Frequency histogram | Chart Examples ...
- Frequency histogram - Page load time | Web Performance ...
- Histograms | Design elements - Histograms | Histogram template ...
- Histograms | Chart Examples | Beetles in the river Thames ...
- Histograms | Histogram Chart | How to Draw a Histogram in ...
- How to Draw a Histogram in ConceptDraw PRO | How Do You Make ...
- Histogram Chart | How to Draw a Histogram in ConceptDraw PRO ...
- Histograms | Making a Histogram | Make a Histogram | Histograms ...
- How to Draw a Line Graph | Line Graph | Picture Graph | Iine Graph ...
- How to Draw a Histogram in ConceptDraw PRO | Education charts ...
- Comparison Dashboard | SWOT Sample in Computers | Matrices ...
- Marketing Flow Chart | Marketing Organization Chart | Market Chart ...
- Images Of Double Bar Graph
- Design elements - Histogram | Histograms - Vector stencils library ...
- Chart Examples | Line Chart Examples | Bar Chart Examples | Area ...
- PM Personal Time Management | How to Operate with Project Time ...
- Chart Examples | Garrett IA Diagrams with ConceptDraw PRO ...
- Line Chart Examples | Chart Examples | Picture graph - Population ...