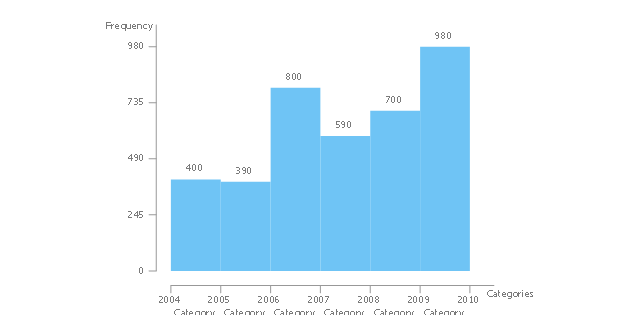
The vector stencils library "Histograms" contains 8 templates of histograms for visualizing frequency distribution data.
Drag a template from the library to your document and enter your data.
Use these shapes to draw your histograms in ConceptDraw PRO diagramming and vector drawing software.
The vector stencils library "Histograms" is included in the Histograms solution from the Graphs and Charts area of ConceptDraw Solution Park.
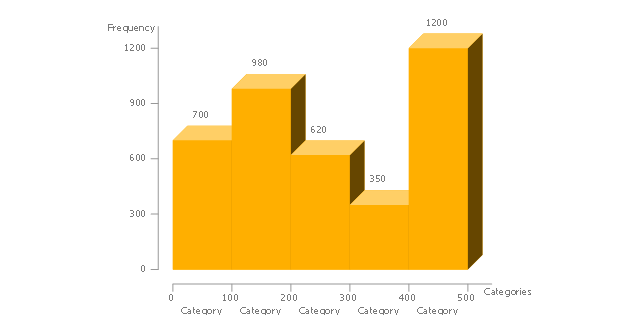
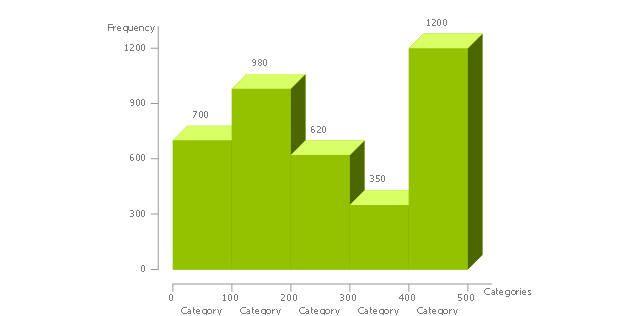
Frequency histogram
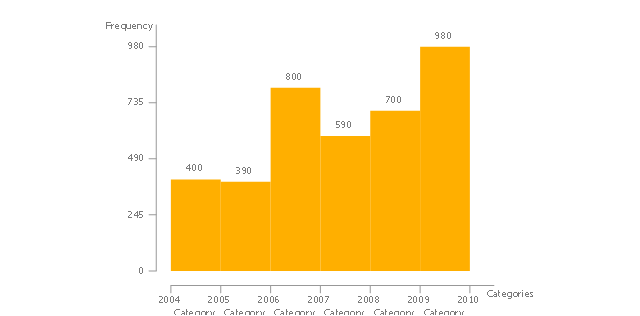
Frequency histogram 2
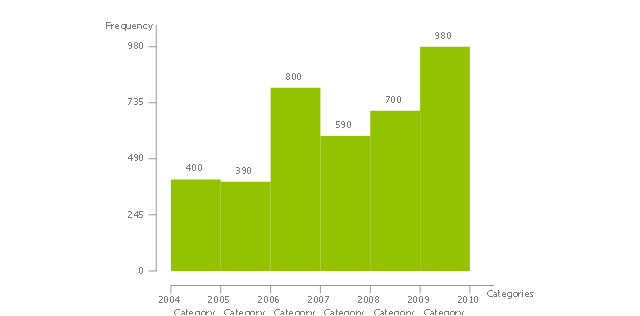
Frequency histogram 3
Frequency histogram (table)
-histograms---vector-stencils-library.png--diagram-flowchart-example.png)
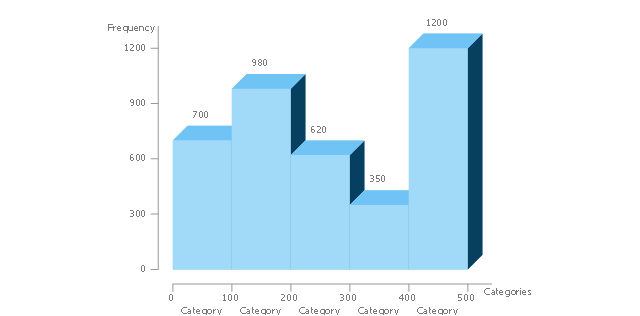
3D frequency histogram
3D frequency histogram 2
3D frequency histogram 3
3D frequency histogram (table)
-histograms---vector-stencils-library.png--diagram-flowchart-example.png)
HelpDesk
How to Draw a Histogram in ConceptDraw PRO

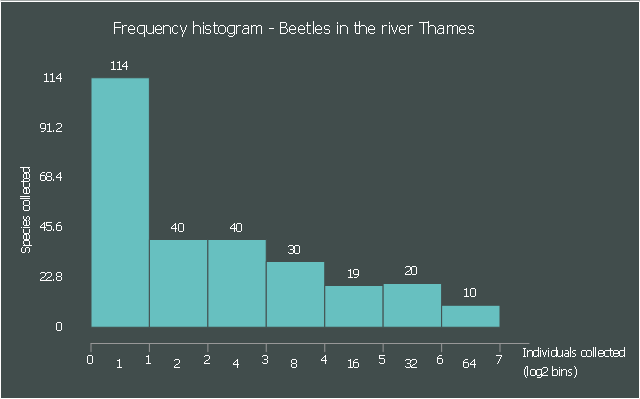
This frequency histogram sample shows the relative species abundance of beetles sampled from the river Thames. It was designed on the base of the Wikimedia Commons file: PrestonPlot beetles.png.
[commons.wikimedia.org/ wiki/ File:PrestonPlot_ beetles.png]
"Relative species abundance is a component of biodiversity and refers to how common or rare a species is relative to other species in a defined location or community. Relative species abundances tend to conform to specific patterns that are among the best-known and most-studied patterns in macroecology. ...
Relative species abundance distributions are usually graphed as frequency histograms (“Preston Plots”) or rank-abundance diagrams ("Whittaker Plots”)." [Relative species abundance. Wikipedia]
The frequency histogram example "Beetles in the river Thames" was created using the ConceptDraw PRO diagramming and vector drawing software extended with the Histograms solution from the Graphs and Charts area of ConceptDraw Solution Park.
Frequency histogram
The vector stencils library "Histograms" contains 8 templates of histograms for visualizing frequency distribution data.
Drag a template from the library to your document and enter your data.
Use these shapes to draw your histograms in ConceptDraw PRO diagramming and vector drawing software.
The vector stencils library "Histograms" is included in the Histograms solution from the Graphs and Charts area of ConceptDraw Solution Park.
Drag a template from the library to your document and enter your data.
Use these shapes to draw your histograms in ConceptDraw PRO diagramming and vector drawing software.
The vector stencils library "Histograms" is included in the Histograms solution from the Graphs and Charts area of ConceptDraw Solution Park.
Frequency histogram
Frequency histogram 2
Frequency histogram 3
Frequency histogram (table)
3D frequency histogram
3D frequency histogram 2
3D frequency histogram 3
3D frequency histogram (table)
This frequency histogram sample shows the relative species abundance of beetles sampled from the river Thames. It was designed on the base of the Wikimedia Commons file: PrestonPlot beetles.png.
[commons.wikimedia.org/ wiki/ File:PrestonPlot_ beetles.png]
"Relative species abundance is a component of biodiversity and refers to how common or rare a species is relative to other species in a defined location or community. Relative species abundances tend to conform to specific patterns that are among the best-known and most-studied patterns in macroecology. ...
Relative species abundance distributions are usually graphed as frequency histograms (“Preston Plots”) or rank-abundance diagrams ("Whittaker Plots”)." [Relative species abundance. Wikipedia]
The frequency histogram example "Beetles in the river Thames" was created using the ConceptDraw PRO diagramming and vector drawing software extended with the Histograms solution from the Graphs and Charts area of ConceptDraw Solution Park.
[commons.wikimedia.org/ wiki/ File:PrestonPlot_ beetles.png]
"Relative species abundance is a component of biodiversity and refers to how common or rare a species is relative to other species in a defined location or community. Relative species abundances tend to conform to specific patterns that are among the best-known and most-studied patterns in macroecology. ...
Relative species abundance distributions are usually graphed as frequency histograms (“Preston Plots”) or rank-abundance diagrams ("Whittaker Plots”)." [Relative species abundance. Wikipedia]
The frequency histogram example "Beetles in the river Thames" was created using the ConceptDraw PRO diagramming and vector drawing software extended with the Histograms solution from the Graphs and Charts area of ConceptDraw Solution Park.
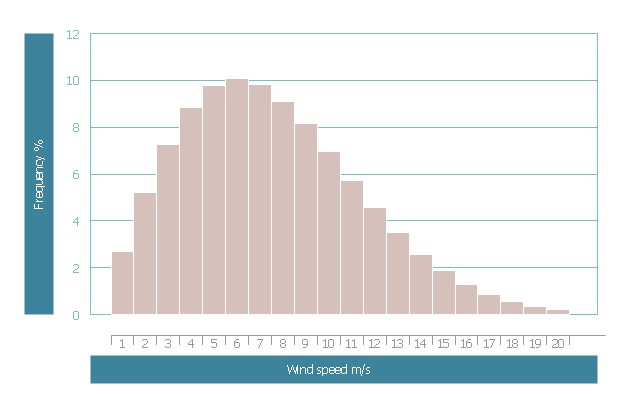
Frequency histogram
This wind speed frequency distribution histogram example was redesigned from the Wikimedia Commons file: Frekvensfördelning.jpg.
[commons.wikimedia.org/ wiki/ File:Frekvensf%C3%B6rdelning.jpg]
This file is licensed under the Creative Commons Attribution-Share Alike 3.0 Unported license. [creativecommons.org/ licenses/ by-sa/ 3.0/ deed.en]
Example of frequency distribution of wind speed. Each bar represents the range of 1 m / s. Over 10 percent of the time the wind blows from 5.5 to 6.5 m / s, which is the most common wind speed. The mean wind speed is 7 m / s. [Vindkraft. Swedish Wikipedia]
The example "Wind speed histogram" was created using the ConceptDraw PRO software extended with the Seven Basic Tools of Quality solution from the Quality area of ConceptDraw Solution Park.
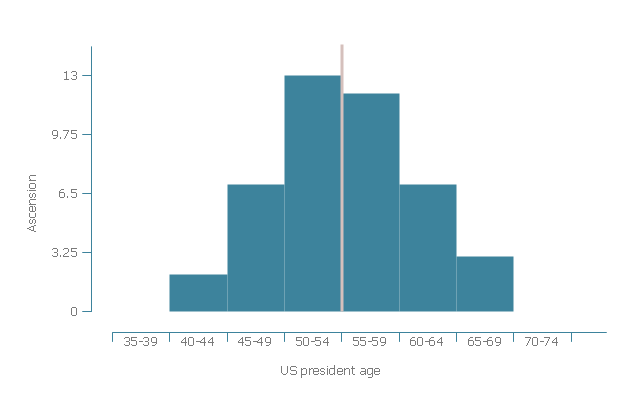
Histogram example
This histogram example was redesigned from the Wikimedia Commons file: Age of presidental ascention.jpg.
"Age of US president at date of ascension to office in five-year age groups."
[commons.wikimedia.org/ wiki/ File:Age_ of_ presidental_ ascention.jpg]
This file is licensed under the Creative Commons Attribution-Share Alike 3.0 Unported license. [creativecommons.org/ licenses/ by-sa/ 3.0/ deed.en]
"Age of presidents when assuming office approximately follows a bell curve (mean age marked by red line, c. 55 years)" [List of Presidents of the United States by age. Wikipedia]
The histogram example "Age of presidential ascension" was created using the ConceptDraw PRO software extended with the Seven Basic Tools of Quality solution from the Quality area of ConceptDraw Solution Park.
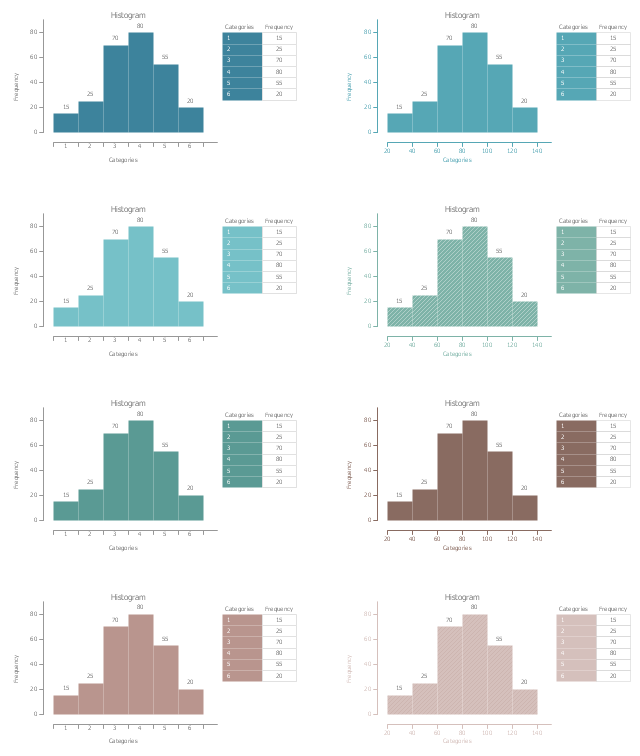
Histogram
The vector stencils library "Histogram" contains 8 templates of histogram.
Use it to design your histograms with ConceptDraw PRO diagramming and vector drawing software.
"A histogram is a graphical representation of the distribution of numerical data. It is an estimate of the probability distribution of a continuous variable (quantitative variable) and was first introduced by Karl Pearson. ...
The histogram is one of the seven basic tools of quality control." [Histogram. Wikipedia]
The example of diagram templates "Design elements - Histogram" is included in the Seven Basic Tools of Quality solution from the Quality area of ConceptDraw Solution Park.
Histogram templates
The vector stencils library "Data-driven charts" contains 13 data-driven graphs and charts: area chart, divided bar diagram, double bar graph, frequency histogram, horizontal bar chart, line graph, percentage ring chart, percentage pie chart, scatter plot, column chart, waterfall chart.
Use it to visualize quantitative data in your data-driven infographics.
The graphs example "Data-driven charts - Vector stencils library" was created using the ConceptDraw PRO diagramming and vector graphics software extended with the Data-driven Infographics solution from the area "What is infographics" of ConceptDraw Solution Park.
Area chart

Divided bar diagram

Double bar graph

Frequency histogram

Horizontal bar graph

Line graph

Percentage ring chart

Pie chart

Percentage pie chart

Ring chart

Scatter plot

Column chart (vertical bar graph)
-data-driven-charts---vector-stencils-library.png--diagram-flowchart-example.png)
Waterfall chart

- Frequency Histogram Template
- Beetles in the river Thames - Frequency histogram | How Do You ...
- Page load time - Frequency histogram | Histogram Chart | Make a ...
- Page load time - Frequency histogram | Chart Examples ...
- How to Draw a Histogram in ConceptDraw PRO | Histograms ...
- Histograms - Vector stencils library | Graphs and Charts Area ...
- Histograms | How To Make a Histogram ? | How to Draw a Histogram ...
- Beetles in the river Thames | Relative Species Abundance
- Beetles in the river Thames - Frequency histogram | Preston
- How to Draw a Histogram in ConceptDraw PRO | Histogram ...
- Beetles in the river Thames - Frequency histogram
- Frequency Distribution Dashboard | ConceptDraw Solution Park ...
- Making a Histogram | Histogram example - Age of presidential ...
- Frequency histogram
- Frequency histogram 5
- Histograms - Vector stencils library
- Frequency histogram 4
- Histograms - Vector stencils library
- Frequency histogram 3