This histogram example was redesigned from the Wikimedia Commons file: PrestonPlot beetles.png.
[commons.wikimedia.org/ wiki/ File:PrestonPlot_ beetles.png]
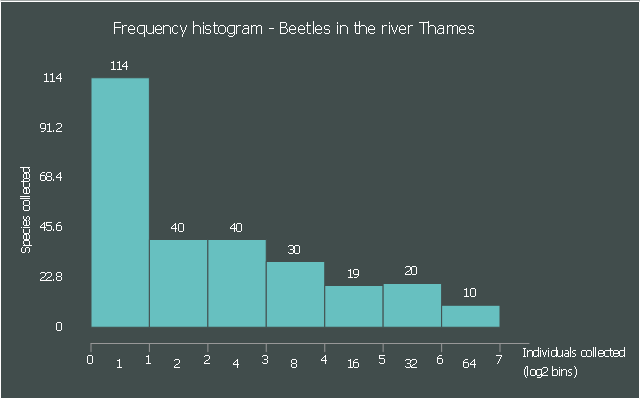
"Relative species abundance is a component of biodiversity and refers to how common or rare a species is relative to other species in a defined location or community. Relative species abundances tend to conform to specific patterns that are among the best-known and most-studied patterns in macroecology. ...
Relative species abundance distributions are usually graphed as frequency histograms (“Preston Plots”) or rank-abundance diagrams ("Whittaker Plots”)." [Relative species abundance. Wikipedia]
The example "Beetles in the river Thames" was created using the ConceptDraw PRO diagramming and vector drawing software extended with the Histograms solution from the Graphs and Charts area of ConceptDraw Solution Park.
[commons.wikimedia.org/ wiki/ File:PrestonPlot_ beetles.png]
"Relative species abundance is a component of biodiversity and refers to how common or rare a species is relative to other species in a defined location or community. Relative species abundances tend to conform to specific patterns that are among the best-known and most-studied patterns in macroecology. ...
Relative species abundance distributions are usually graphed as frequency histograms (“Preston Plots”) or rank-abundance diagrams ("Whittaker Plots”)." [Relative species abundance. Wikipedia]
The example "Beetles in the river Thames" was created using the ConceptDraw PRO diagramming and vector drawing software extended with the Histograms solution from the Graphs and Charts area of ConceptDraw Solution Park.
Histogram
How Do You Make a Histogram?

 Histograms
How to make a Histogram? Making a Histogram is an incredibly easy process when it is done with ConceptDraw PRO. The Histograms Solution enhances ConceptDraw PRO v10 functionality with extensive drawing tools, numerous samples, and examples; also a quick-start template and library of ready vector stencils for visualization the data and professional drawing Histograms.
- Beetles in the river Thames - Frequency histogram | Relative ...
- Beetles in the river Thames - Frequency histogram | Geography ...
- Page load time - Frequency histogram | Beetles in the river Thames ...
- Geo Map - South America - Venezuela
- Making a Histogram | How To Make a Histogram? | Histograms ...
- Histograms | How to Draw a Histogram in ConceptDraw PRO | Page ...
- Histograms Solution
- Geography - Vector stencils library | Cafe and Restaurant Floor ...
- Hydrologic Valve Symbol
- Draw Hill Mountain River Forest
- River Illustration Png
- Page load time - Frequency histogram | Histogram Chart | Make a ...
- Geography - Vector stencils library | Photos Of River Flowing From ...
- Drawing Of Mountains Rivers Forests Seas
- How To Draw Hills River
- Page load time - Frequency histogram | How to Draw a Histogram in ...
- Design elements - Geography | Geography - Vector stencils library ...
- Geography - Vector stencils library | Design elements - Geography ...
- River Clipart Black And White
- Free Clip Art River Flowing To The Sea