"Web performance optimization, WPO, or website optimization is the field of knowledge about increasing the speed in which web pages are downloaded and displayed on the user's web browser. ...
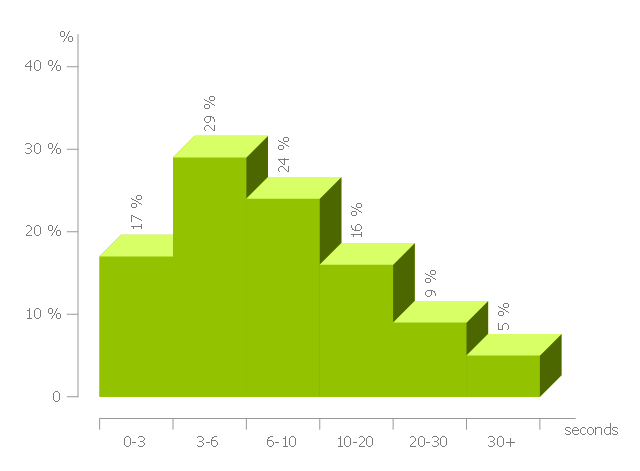
With the average internet speed now increasing globally, it's fitting for website administrators and "webmasters" to consider the time it takes for websites to render for the visitor.
Faster website download speeds have been shown to increase visitor retention and loyalty and user satisfaction, especially for users with slow internet connections and those on mobile devices. Web performance also leads to less data travelling across the web, which in turn lowers a website's power consumption and environmental impact. Some aspects which can affect the speed of page load include Browser/ Server Cache, Image Optimization and also encryption (for example SSL), which can affect the time it takes for pages to render." [Web performance optimization. Wikipedia]
The histogram example "Page load time" was created using the ConceptDraw PRO diagramming and vector drawing software extended with the Histograms solution from the Graphs and Charts area of ConceptDraw Solution Park.
Histogram
HelpDesk
How to Draw a Histogram in ConceptDraw PRO

Make a Histogram

Histogram Chart

Seven Basic Tools of Quality - Histogram

 Histograms
How to make a Histogram? Making a Histogram is an incredibly easy process when it is done with ConceptDraw PRO. The Histograms Solution enhances ConceptDraw PRO v10 functionality with extensive drawing tools, numerous samples, and examples; also a quick-start template and library of ready vector stencils for visualization the data and professional drawing Histograms.
Chart Examples

Pictures of Graphs

How to Create a Pyramid Diagram

How To Make a Histogram?

Basic Diagramming


Seven Basic Tools of Quality - Quality Control

HelpDesk
How to Create PowerPoint Presentation from Data Driven Infographics Using ConceptDraw PRO

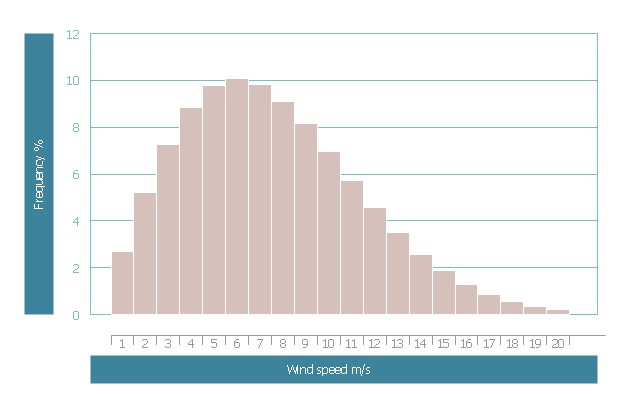
This wind speed frequency distribution histogram example was redesigned from the Wikimedia Commons file: Frekvensfördelning.jpg.
[commons.wikimedia.org/ wiki/ File:Frekvensf%C3%B6rdelning.jpg]
This file is licensed under the Creative Commons Attribution-Share Alike 3.0 Unported license. [creativecommons.org/ licenses/ by-sa/ 3.0/ deed.en]
Example of frequency distribution of wind speed. Each bar represents the range of 1 m / s. Over 10 percent of the time the wind blows from 5.5 to 6.5 m / s, which is the most common wind speed. The mean wind speed is 7 m / s. [Vindkraft. Swedish Wikipedia]
The example "Wind speed histogram" was created using the ConceptDraw PRO software extended with the Seven Basic Tools of Quality solution from the Quality area of ConceptDraw Solution Park.
Histogram example
The vector stencils library "Process flowchart" contains 9 flow chart symbols.
Use it to design your process flowcharts with ConceptDraw PRO diagramming and vector drawing software.
"A flowchart is a type of diagram that represents an algorithm, workflow or process, showing the steps as boxes of various kinds, and their order by connecting them with arrows. ...
Kaoru Ishikawa defined the flowchart as one of the seven basic tools of quality control, next to the histogram, Pareto chart, check sheet, control chart, cause-and-effect diagram, and the scatter diagram. ...
Common alternative names include: flowchart, process flowchart, functional flowchart, process map, process chart, functional process chart, business process model, process model, process flow diagram, work flow diagram, business flow diagram. The terms "flowchart" and "flow chart" are used interchangeably." [Flowchart. Wikipedia]
The example of flow chart symbols "Design elements - Process flowchart" is included in the Seven Basic Tools of Quality solution from the Quality area of ConceptDraw Solution Park.
Process flowchart symbols

- Page load time - Frequency histogram | Histogram Chart | Make a ...
- Histograms | How to Draw a Histogram in ConceptDraw PRO | Page ...
- Page load time - Frequency histogram | Beetles in the river Thames ...
- Page load time - Frequency histogram | Chart Examples ...
- Frequency histogram - Page load time | Web Performance ...
- How to Draw a Histogram in ConceptDraw PRO | How Do You Make ...
- Histograms | Design elements - Histograms | Histogram - Template ...
- Histograms | Making a Histogram | Make a Histogram | Histograms ...
- Histograms | Histogram Chart | How to Draw a Histogram in ...
- How to Draw a Histogram in ConceptDraw PRO | How Do You Make ...
- Making a Histogram | Chart Examples | Histograms | Histogram ...
- Histogram Chart | How to Draw a Histogram in ConceptDraw PRO ...
- Column Graph Histogram
- Seven Basic Tools of Quality - Histogram | Histograms | Making a ...
- Beetles in the river Thames - Frequency histogram | Relative ...
- Histogram And Pie Diagram
- Histogram Languages Spoken
- Design elements - Histogram | Histograms - Vector stencils library ...
- How to Draw a Histogram in ConceptDraw PRO | Chart Examples ...
- On Which Page Divided Rectangle Is Drawn