 Histograms
How to make a Histogram? Making a Histogram is an incredibly easy process when it is done with ConceptDraw PRO. The Histograms Solution enhances ConceptDraw PRO v10 functionality with extensive drawing tools, numerous samples, and examples; also a quick-start template and library of ready vector stencils for visualization the data and professional drawing Histograms.
Histogram Chart

HelpDesk
How to Draw a Histogram in ConceptDraw PRO

Making a Histogram

How To Make Histogram in ConceptDraw PRO?

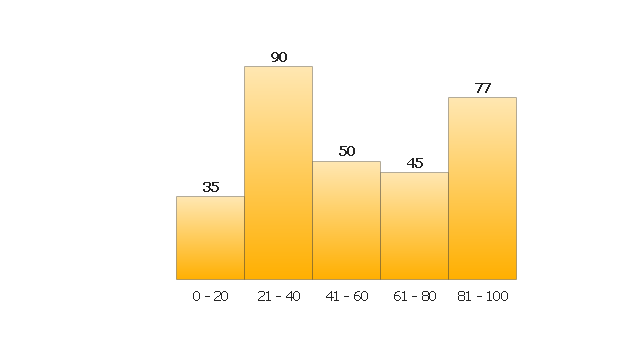
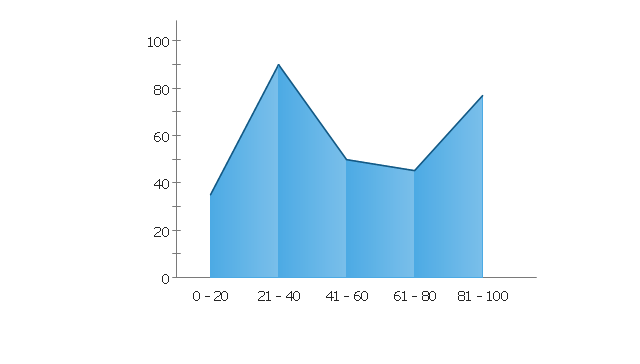
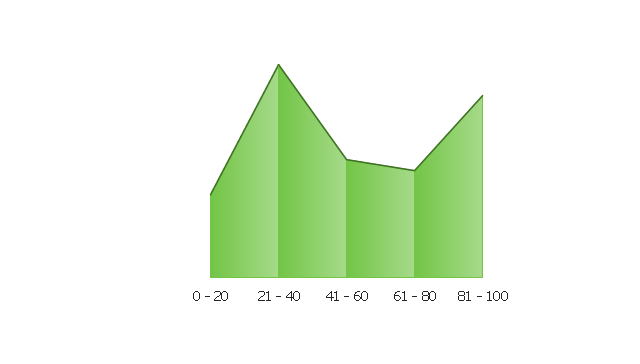
The vector stencils library "Frequency distribution charts" contains 2 area chart templates and 2 histogram templates.
Frequency distribution charts are Live Objects which show the distribution of items within numerical ranges.
Use this library for drawing visual dashboards in the ConceptDraw PRO diagramming and vector drawing software extended with the Frequency Distribution Dashboard solution from the area "What is a Dashboard" of ConceptDraw Solution Park.
Histogram 1

Histogram 2
Area Chart 1
Area Chart 2
Data Source File Example
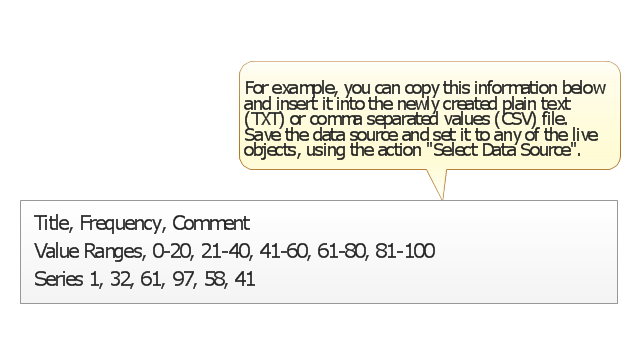
Chart Examples

How To Draw a Histogram?

Make a Histogram

Histogram

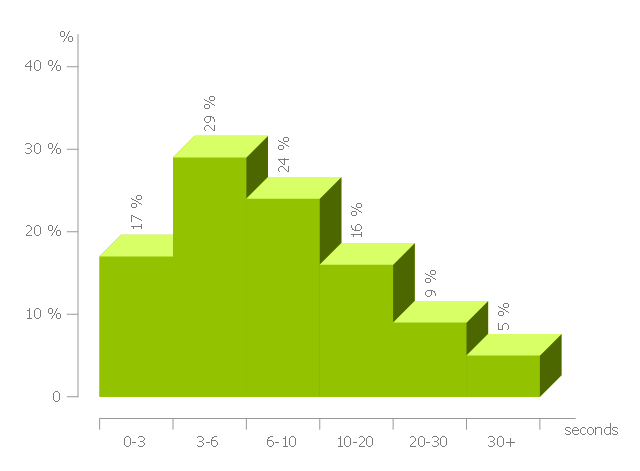
"Web performance optimization, WPO, or website optimization is the field of knowledge about increasing the speed in which web pages are downloaded and displayed on the user's web browser. ...
With the average internet speed now increasing globally, it's fitting for website administrators and "webmasters" to consider the time it takes for websites to render for the visitor.
Faster website download speeds have been shown to increase visitor retention and loyalty and user satisfaction, especially for users with slow internet connections and those on mobile devices. Web performance also leads to less data travelling across the web, which in turn lowers a website's power consumption and environmental impact. Some aspects which can affect the speed of page load include Browser/ Server Cache, Image Optimization and also encryption (for example SSL), which can affect the time it takes for pages to render." [Web performance optimization. Wikipedia]
The histogram example "Page load time" was created using the ConceptDraw PRO diagramming and vector drawing software extended with the Histograms solution from the Graphs and Charts area of ConceptDraw Solution Park.
Histogram
How Do You Make a Histogram?

How To Make a Histogram?

The vector stencils library "Data-driven charts" contains 13 data-driven graphs and charts: area chart, divided bar diagram, double bar graph, frequency histogram, horizontal bar chart, line graph, percentage ring chart, percentage pie chart, scatter plot, column chart, waterfall chart.
Use it to visualize quantitative data in your data-driven infographics.
The graphs example "Data-driven charts - Vector stencils library" was created using the ConceptDraw PRO diagramming and vector graphics software extended with the Data-driven Infographics solution from the area "What is infographics" of ConceptDraw Solution Park.
Area chart

Divided bar diagram

Double bar graph

Frequency histogram

Horizontal bar graph

Line graph

Percentage ring chart

Pie chart

Percentage pie chart

Ring chart

Scatter plot

Column chart (vertical bar graph)
-data-driven-charts---vector-stencils-library.png--diagram-flowchart-example.png)
Waterfall chart

Basic Diagramming


Visual Presentations Made Easy with Diagramming Software

Simple Diagramming

Bar Chart Examples

The Best Drawing Program for Mac

Basic Diagramming

- Histograms | Chart Examples | Bar Chart Examples | Histogram Visio
- Chart Examples | Projects HR dashboard | Column Chart Examples ...
- Design elements - Histograms | Histogram template | Design ...
- Histogram template | Frequency histogram - Page load time | Chart ...
- How to Draw a Histogram in ConceptDraw PRO | Chart Examples ...
- Histograms | Chart Examples | Black cherry tree histogram ...
- How to Draw a Histogram in ConceptDraw PRO | Chart Examples ...
- Chart Examples | Basic Diagramming | Best Software to Draw ...
- Histograms | Chart Examples | Frequency histogram - Beetles in the ...
- Histograms | Frequency Distribution Dashboard | Pyramid Chart ...
- Histograms | Visual Presentations Made Easy with Diagramming ...
- Frequency histogram - Page load time | Frequency histogram ...
- Histograms - Vector stencils library | Graphs and Charts Area ...
- Histogram template | Design elements - Histograms | Basic ...
- Histograms | Design elements - Histograms | Histogram template ...
- Frequency histogram - Page load time | Web Performance ...
- Histograms | Best Multi-Platform Diagram Software | Basic ...
- The Best Drawing Program for Mac | Chart Examples | Best Multi ...
- HR dashboard | Projects HR dashboard | Employee dashboard | Hr ...
- Employee dashboard | Frequency Distribution Dashboard | HR ...