HelpDesk
How to Draw a Histogram in ConceptDraw PRO

How Do You Make a Histogram?

How To Make Histogram in ConceptDraw PRO?

How To Make a Histogram?

Histogram

 Histograms
How to make a Histogram? Making a Histogram is an incredibly easy process when it is done with ConceptDraw PRO. The Histograms Solution enhances ConceptDraw PRO v10 functionality with extensive drawing tools, numerous samples, and examples; also a quick-start template and library of ready vector stencils for visualization the data and professional drawing Histograms.
Making a Histogram

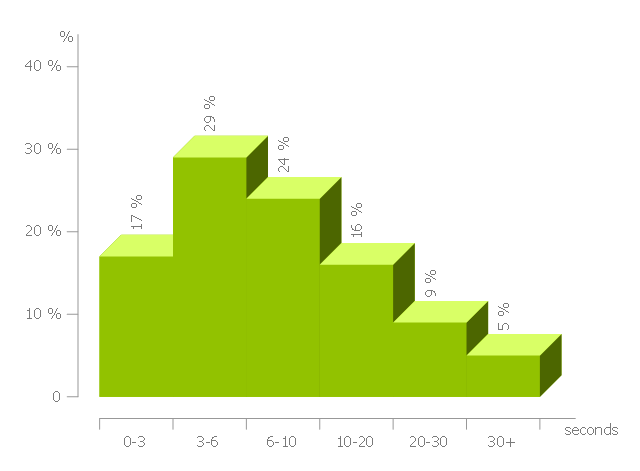
This histogram sample shows the frequency distribution of web page load time.
"Web performance optimization, WPO, or website optimization is the field of knowledge about increasing the speed in which web pages are downloaded and displayed on the user's web browser. ...
With the average internet speed now increasing globally, it's fitting for website administrators and "webmasters" to consider the time it takes for websites to render for the visitor.
Faster website download speeds have been shown to increase visitor retention and loyalty and user satisfaction, especially for users with slow internet connections and those on mobile devices. Web performance also leads to less data travelling across the web, which in turn lowers a website's power consumption and environmental impact. Some aspects which can affect the speed of page load include Browser/ Server Cache, Image Optimization and also encryption (for example SSL), which can affect the time it takes for pages to render." [Web performance optimization. Wikipedia]
The histogram example "Page load time" was created using the ConceptDraw PRO diagramming and vector drawing software extended with the Histograms solution from the Graphs and Charts area of ConceptDraw Solution Park.
Histogram
Simple Drawing Applications for Mac

Basic Diagramming


Make a Histogram

The Best Drawing Program for Mac

Basic Diagramming


Best Program to Make Diagrams


Basic Diagramming

Chart Examples

 Basic Diagramming
This solution extends ConceptDraw PRO software with the specific tools you need to easily draw flowcharts, block diagrams, histograms, pie charts, divided bar diagrams, line graphs, circular arrows diagrams, Venn diagrams, bubble diagrams and concept maps
Best Vector Drawing Application for Mac OS X

The Best Flowchart Software Available

- How to Draw a Histogram in ConceptDraw PRO | Chart Examples ...
- Histograms | Chart Examples | Bar Chart Examples | Histogram Visio
- Chart Examples | Basic Diagramming | Best Software to Draw ...
- Histograms | Visual Presentations Made Easy with Diagramming ...
- Histogram template | Frequency histogram - Page load time | Chart ...
- Histograms | Best Multi-Platform Diagram Software | Basic ...
- Histograms | Design elements - Histograms | Histogram template ...
- Best Multi-Platform Diagram Software | The Best Drawing Program ...
- The Best Drawing Program for Mac | Best Software to Draw ...
- Design elements - Histograms | Histogram template | Design ...
- Histograms | Frequency Distribution Dashboard | Pyramid Chart ...
- Histograms | Chart Examples | Black cherry tree histogram ...
- Histograms | Chart Examples | Frequency histogram - Beetles in the ...
- The Best Drawing Program for Mac | Chart Examples | Best Multi ...
- Chart Examples | Projects HR dashboard | Column Chart Examples ...
- Histogram template | Design elements - Histograms | Basic ...
- Histograms - Vector stencils library | Graphs and Charts Area ...
- Projects HR dashboard | Simple Drawing Applications for Mac ...
- Frequency histogram - Page load time | Frequency histogram ...
- Simple Diagramming | Simple Drawing Applications for Mac | Visual ...