How to Create Data-Driven Infographics
Data Driven Infographics are used to represent data in a graphic format to make it easily understandable at a glance.
It can be used to quickly communicate a message, to simplify the presentation of large amounts of data, to see data patterns and relationships, and to monitor changes in variables over time. Data-driven Infographics can contain bar graphs, pie charts, histograms, line charts, e.t.c. Data-driven Infographics are often used in management and marketing. Ability to create Data-driven Infographics in ConceptDraw DIAGRAM is contained in the Data Driven Infographics solution.
- Run ConceptDraw DIAGRAM.
- Doubleclick the preview of Data Driven Infographics template to open the template in ConceptDraw DIAGRAM.
- Add objects to the drawing by dragging them from the library to the document page.
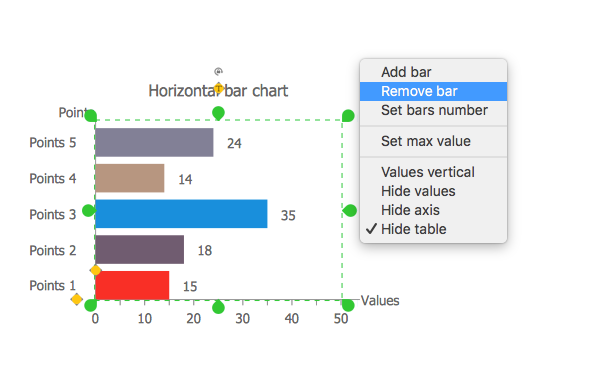
- To make changes in your infographic elements use the Action button menu. To open the menu select an object and click the
 button in the upper right corner of the object. button in the upper right corner of the object.

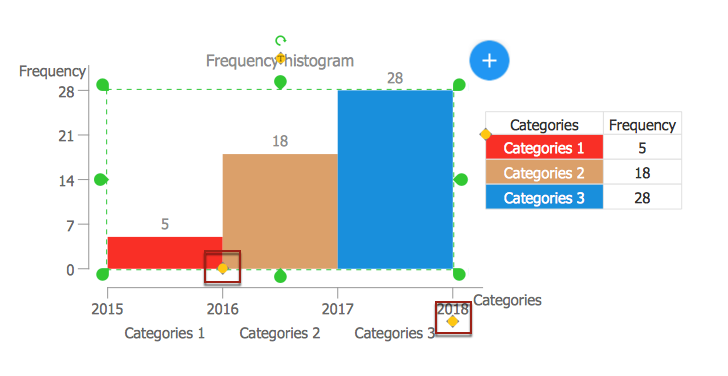
- To move value labels or to change bar width and space between bars use control dots.

- To add a text to infographics, select an object and start typing.
- Use the Line, Fill, Shadow and Text tools to format infographic objects.
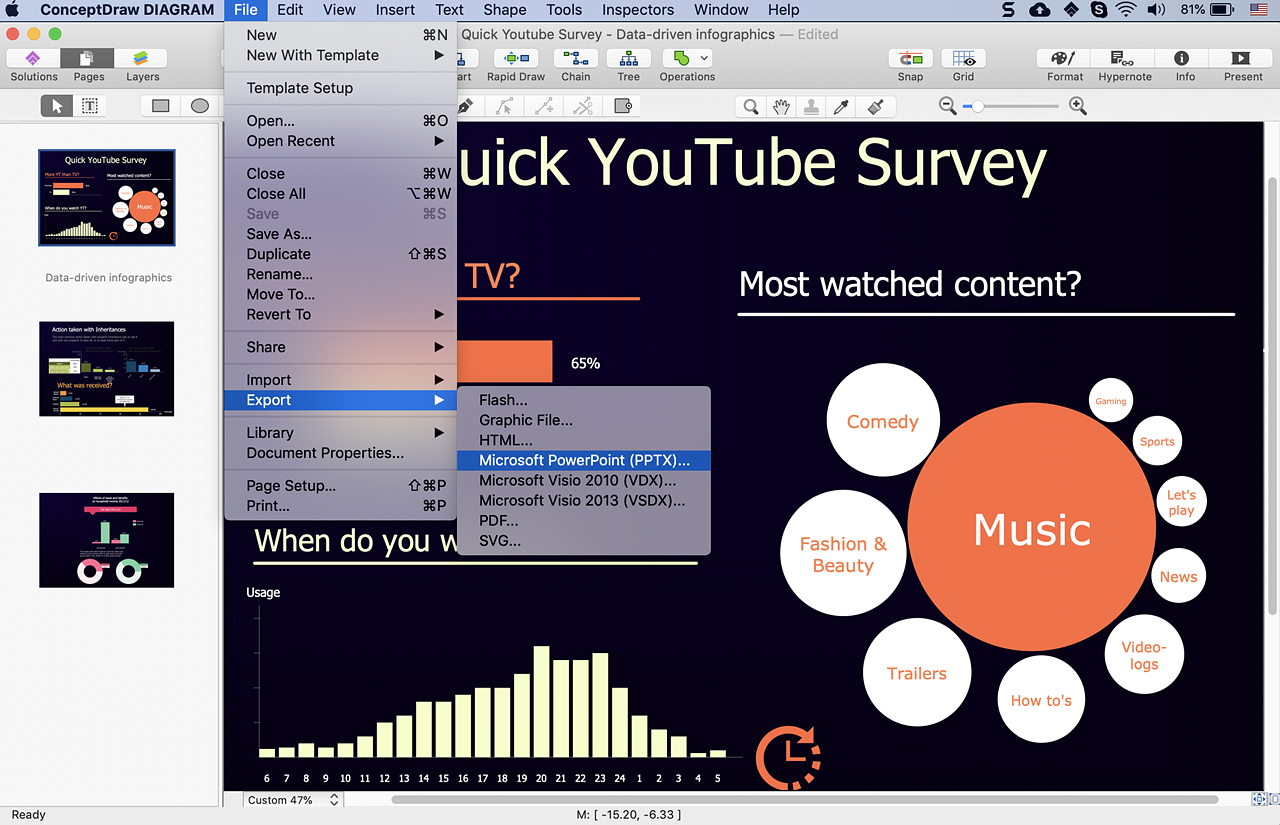
- Finally, you can export your drawing as MS PowerPoint® and Adobe PDF files using Export options from the File menu.

Result: Using ConceptDraw DIAGRAM you can easily make data-driven infographics of any complexity.
|
How it works:
- Set of ready-to-use templates supplied with ConceptDraw DIAGRAM
- Collection of professional samples supports each template
Useful Solutions and Products:
- Block Diagrams
- Bubble Diagrams
- Circle-Spoke Diagrams
- Circular Arrows Diagrams
- Concept Maps
- Flowcharts
- Data Driven Charts
- Special templates
- Infographic examples
- Diagraming and Charts
- Vector Illustrations
- Maps
- Floor plans
- Engineering drawings
- Business dashboards
- Infographics
- Presentation
- Over 10 000 vector stencils
- Export to vector graphics files
- Export to Adobe Acrobat® PDF
- Export to MS PowerPoint®
- Export to MS Visio® VSDX, VDX
|


 Business-specific Drawings