 Frequency Distribution Dashboard
Frequency distribution dashboard solution extends ConceptDraw PRO software with samples, templates and vector stencils libraries with histograms and area charts for drawing the visual dashboards showing frequency distribution of data.
 Logistics Flow Charts
Logistics Flow Charts solution extends ConceptDraw PRO v11 functionality with opportunities of powerful logistics management software. It provides large collection of predesigned vector logistic symbols, pictograms, objects and clipart to help you design with pleasure Logistics flow chart, Logistics process flow diagram, Inventory flow chart, Warehouse flowchart, Warehouse management flow chart, Inventory control flowchart, or any other Logistics diagram. Use this solution for logistics planning, to reflect logistics activities and processes of an enterprise or firm, to depict the company's supply chains, to demonstrate the ways of enhancing the economic stability on the market, to realize logistics reforms and effective products' promotion.
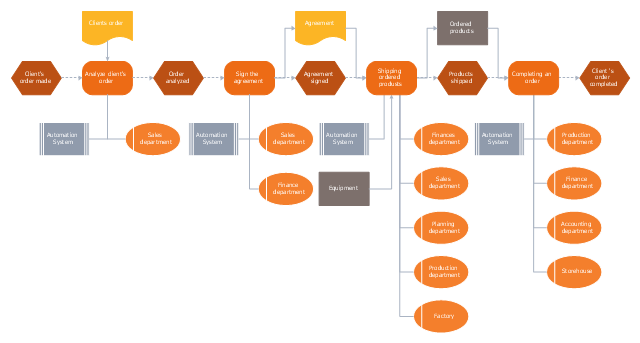
"Order processing is a key element of Order fulfillment. Order processing operations or facilities are commonly called "distribution centers". "Order processing" is the term generally used to describe the process or the work flow associated with the picking, packing and delivery of the packed item(s) to a shipping carrier. The specific "order fulfillment process" or the operational procedures of distribution centers are determined by many factors. Each distribution center has its own unique requirements or priorities. There is no "one size fits all" process that universally provides the most efficient operation." [Order processing. Wikipedia]
The business process modeling (BPM) flowchart example "Order processing - EPC flow chart" was created using the ConceptDraw PRO diagramming and vector drawing software extended with the Event-driven Process Chain Diagrams solution from the Business Processes area of ConceptDraw Solution Park.
The business process modeling (BPM) flowchart example "Order processing - EPC flow chart" was created using the ConceptDraw PRO diagramming and vector drawing software extended with the Event-driven Process Chain Diagrams solution from the Business Processes area of ConceptDraw Solution Park.
EPC flow chart
This picture bar graph sample shows regional population growth from 2010 to 2016. It was designed using data from the Wikipedia article List of continents by population.
[en.wikipedia.org/ wiki/ List_ of_ continents_ by_ population]
"Population geography is a division of human geography. It is the study of the ways in which spatial variations in the distribution, composition, migration, and growth of populations are related to the nature of places. Population geography involves demography in a geographical perspective. It focuses on the characteristics of population distributions that change in a spatial context." [Population geography. Wikipedia]
The pictorial chart example "Regional population growth from 2010 to 2016" was created using the ConceptDraw PRO diagramming and vector drawing software extended with the Picture Graphs solution from the Graphs and Charts area of ConceptDraw Solution Park.
Image chart

- Chart For Distribution Network For Different Products
- Chart For Distribution Network For Food Products
- Chart Of Distribution Network For Different Products
- Distribution Process Flow Chart
- Logistics Flow Charts | Frequency Distribution Dashboard | Flow ...
- Sales Distribution Flow Chart
- Prepare A Chart For Distribution Network For Different Products
- Frequency Distribution Dashboard | Flow chart Example ...
- Frequency Distribution Dashboard | Flow chart Example ...