A KPI Dashboard
Sales Dashboard Solution
ConceptDraw DIAGRAM is a software for making dashboards that provide company KPI's. The Sales Dashboard Solution allows sales managers to use live data in the dashboards that show all KPI's in a wide variety of graphs. The Sales Dashboard Solution provide a snapshots of the organization performance.
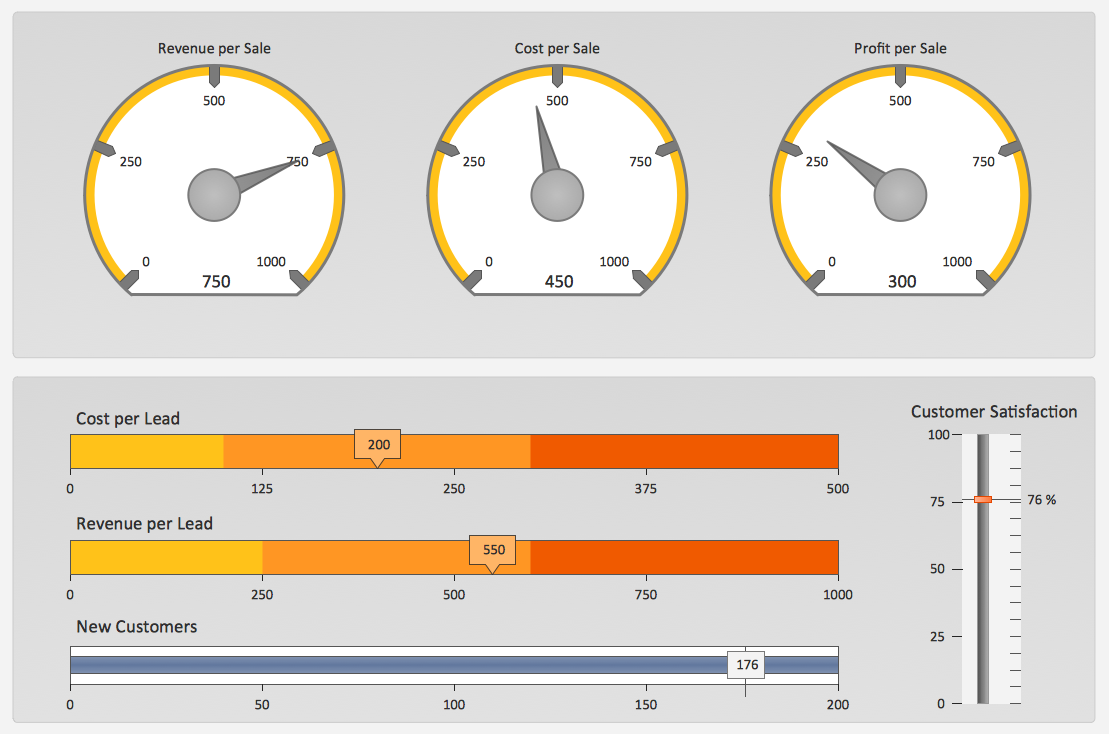
Pic. 1. Sales KPIs Dashboard Sample
THREE RELATED HOW TO's:
What is a KPI? Key performance indicators (KPIs) represent a set of measures that are focused on the aspects of organizational performance which are the most important for its current and future success.
ConceptDraw DIAGRAM diagramming and vector drawing software enhanced with Sales Dashboard solution from the Marketing area of ConceptDraw Solution Park allows effectively develop, analyze and improve your business thanks to the excellent possibility of monitoring all KPIs on one screen in a real time.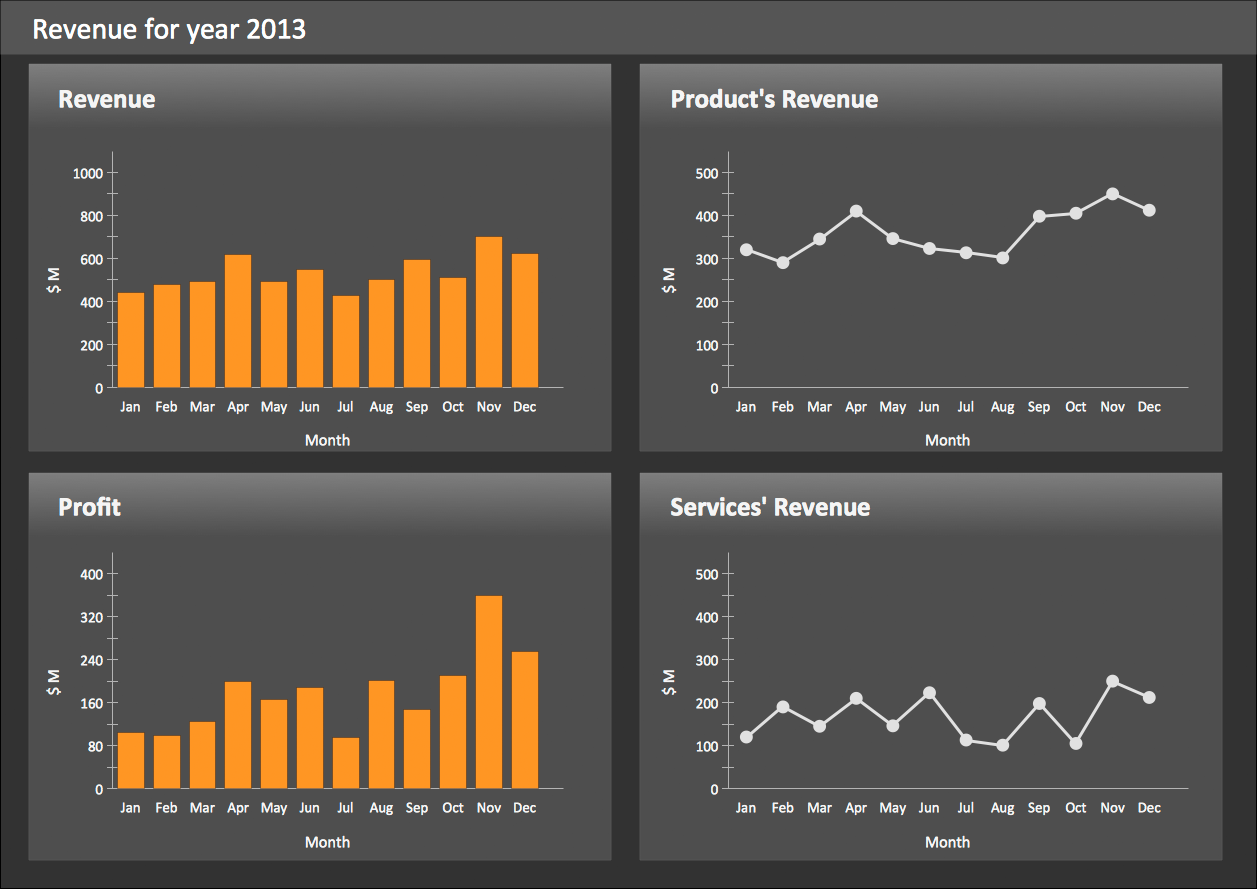
Picture: What is a KPI?
Related Solution:
ConceptDraw DIAGRAM software extended with the Sales Dashboard solution allows you produce sales dashboards for your company easily. You can start from samples and templates delivered with the solution and then modify them to get a dashboard that suites your specific needs.
Picture: Sales Dashboards for Your Company
Use the Relations Diagram to create a relations factors map and to identify which factors are “drivers” and “indicators”. This diagram identifies causal relationships and determine what factors are causes or effects.
ConceptDraw OFFICE suite is a software for relation diagram making.
Picture: PROBLEM ANALYSIS.Relations Diagram
ConceptDraw
DIAGRAM 18