HelpDesk
How to Change Measurement Units in ConceptDraw Drawing

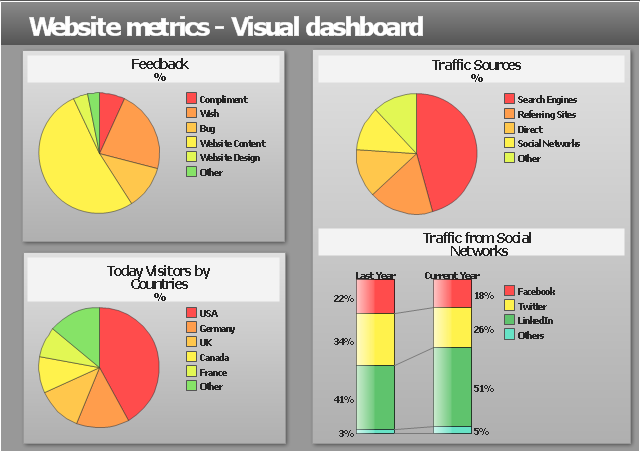
"Web analytics is the measurement, collection, analysis and reporting of internet data for purposes of understanding and optimizing web usage.
Web analytics is not just a tool for measuring web traffic but can be used as a tool for business and market research, and to assess and improve the effectiveness of a web site. Web analytics applications can also help companies measure the results of traditional print or broadcast advertising campaigns. It helps one to estimate how traffic to a website changes after the launch of a new advertising campaign. Web analytics provides information about the number of visitors to a website and the number of page views. It helps gauge traffic and popularity trends which is useful for market research.
There are two categories of web analytics; off-site and on-site web analytics.
Off-site web analytics refers to web measurement and analysis regardless of whether you own or maintain a website.
On-site web analytics measure a visitor's behavior once on your website. This includes its drivers and conversions; for example, the degree to which different landing pages are associated with online purchases. On-site web analytics measures the performance of your website in a commercial context. This data is typically compared against key performance indicators for performance, and used to improve a web site or marketing campaign's audience response." [Web analytics. Wikipedia]
The example "Website metrics - Visual dashboard" was created using the ConceptDraw PRO diagramming and vector drawing software extended with the Composition Dashboard solution from the area "What is a Dashboard" of ConceptDraw Solution Park.
Visual dashboard
The vector stencils library "Sales KPIs and Metrics" contains 15 chart templates and graphic indicators of sales key performance indicators (KPIs) and metrics for drawing sales dashboards: line charts "Cost per order" and "Clicks from Sales Follow-Up Emails", column charts "Social Media Usage" and "Usage Rate of Marketing Collateral", horizontal bar charts "Rate of Follow Up Contact", "Cost per customer" and "Lead Response Time", pie charts "Product mix", "Product Performance" and "Rate of Contact", gauge (speedometer) indicators "Sales Growth" and "Actual vs Plan", bullet indicator "Sales Target", diamond alarm indicators "Average Purchase Value", "Quote to Close Ratio", "Opportunity-to-Win Ratio" and "Sales Ratio".
The dashboard charts and indicators example "Design elements - Sales KPIs and metrics" for the ConceptDraw PRO diagramming and vector drawing software is included in the Sales Dashboard solution from the Marketing area of ConceptDraw Solution Park.
www.conceptdraw.com/ solution-park/ marketing-sales-dashboard
Sales dashboard charts and graphic indicators

HelpDesk
How to Connect a Live Object to a Text Data Source


This sale dashboard example contains KPIs and sales effectiveness metrics visual indicators: speedometer gauge, dial, slider, level meter and bullet indicators.
"Sales effectiveness refers to the ability of a company’s sales professionals to “win” at each stage of the customer’s buying process, and ultimately earn the business on the right terms and in the right timeframe.
Improving sales effectiveness is not just a sales function issue; it’s a company issue, as it requires deep collaboration between sales and marketing to understand what’s working and not working, and continuous improvement of the knowledge, messages, skills, and strategies that sales people apply as they work sales opportunities.
Sales effectiveness has historically been used to describe a category of technologies and consulting services aimed at helping companies improve their sales results.
Many companies are creating sales effectiveness functions and have even given people titles such as VP of Sales Effectiveness." [Sales effectiveness. Wikipedia]
The example "Sales metrics and KPIs" was created using the ConceptDraw PRO diagramming and vector drawing software extended with the Meter Dashboard solution from the area "What is a Dashboard" of ConceptDraw Solution Park.
Sales dashboard

 Meter Dashboard
Meter dashboard solution extends ConceptDraw PRO software with templates, samples and vector stencils library with meter indicators for drawing visual dashboards showing quantitative data.
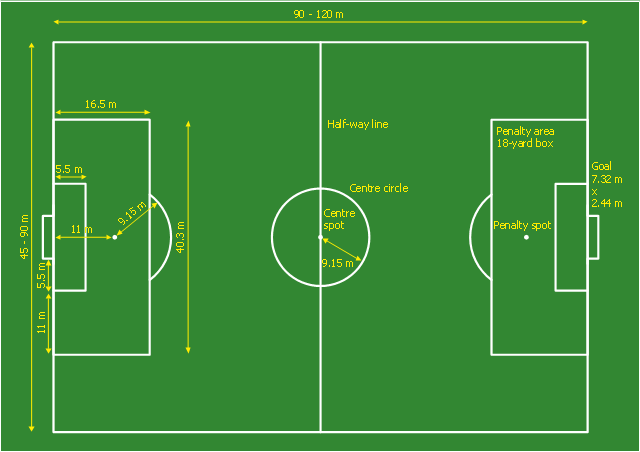
This sport field plan sample was designed on the base of the Wikipedia file: Football pitch metric.svg. [en.wikipedia.org/ wiki/ File:Football_ pitch_ metric.svg]
This file is licensed under the Creative Commons Attribution-Share Alike 3.0 Unported license. [creativecommons.org/ licenses/ by-sa/ 3.0/ deed.en]
"A football pitch (also known as a football field or soccer field) is the playing surface for the game of football made of turf. Its dimensions and markings are defined by Law 1 of the Laws of the Game, "The Field of Play".
All line markings on the pitch form part of the area which they define. For example, a ball on or above the touchline is still on the field of play; a ball on the line of the goal area is in the goal area; and a foul committed over the 16.5-metre (18-yard) line has occurred in the penalty area. Therefore a ball must completely cross the touchline to be out of play, and a ball must wholly cross the goal line (between the goal posts) before a goal is scored; if any part of the ball is still on or above the line, the ball is still in play." [Association football pitch. Wikipedia]
The sport field plan example "Football pitch metric" was created using the ConceptDraw PRO diagramming and vector drawing software extended with the Sport Field Plans solution from the Building Plans area of ConceptDraw Solution Park.
Sport field plan
- Cafe performance metrics vs. air temperature - Visual dashboard ...
- KPIs and Metrics | The Facts and KPIs | KPI Dashboard | Kpis
- KPIs and Metrics | The Facts and KPIs | A KPI Dashboard Provides ...
- KPIs and Metrics | Visualize Sales Data Using Sample Data | Sales ...
- Concept Draw Speedometer How To Use
- Sales metrics and KPIs - Visual dashboard | Sales KPIs ...
- Sales metrics and KPIs - Visual dashboard | Sales dashboard ...
- Hr Metrics Dashboard Example
- Design a Soccer (Football) Field | Football pitch metric | Soccer ...