KPIs and Metrics

The vector stencils library "Sales KPIs and Metrics" contains 15 chart templates and graphic indicators of sales key performance indicators (KPIs) and metrics.
Use it for drawing sales dashboards in the ConceptDraw PRO diagramming and vector drawing software extended with the Sales Dashboard solution from the Marketing area of ConceptDraw Solution Park.
Use it for drawing sales dashboards in the ConceptDraw PRO diagramming and vector drawing software extended with the Sales Dashboard solution from the Marketing area of ConceptDraw Solution Park.
Actual vs Plan

Average Purchase Value

Clicks from Sales Follow-Up Emails

Cost per customer

Cost per order

Lead Response Time

Opportunity-to-Win Ratio

Product mix

Product Performance

Rate of Contact

Rate of Follow Up Contact

Sales Growth

Sales Target

Social Media Usage

Usage Rate of Marketing Collateral

A KPI Dashboard Provides the Answers Your Sales Team

The Facts and KPIs

The vector stencils library "Sales KPIs and Metrics" contains 15 chart templates and graphic indicators of sales key performance indicators (KPIs) and metrics for drawing sales dashboards: line charts "Cost per order" and "Clicks from Sales Follow-Up Emails", column charts "Social Media Usage" and "Usage Rate of Marketing Collateral", horizontal bar charts "Rate of Follow Up Contact", "Cost per customer" and "Lead Response Time", pie charts "Product mix", "Product Performance" and "Rate of Contact", gauge (speedometer) indicators "Sales Growth" and "Actual vs Plan", bullet indicator "Sales Target", diamond alarm indicators "Average Purchase Value", "Quote to Close Ratio", "Opportunity-to-Win Ratio" and "Sales Ratio".
The dashboard charts and indicators example "Design elements - Sales KPIs and metrics" for the ConceptDraw PRO diagramming and vector drawing software is included in the Sales Dashboard solution from the Marketing area of ConceptDraw Solution Park.
www.conceptdraw.com/ solution-park/ marketing-sales-dashboard
Sales dashboard charts and graphic indicators

This sale dashboard example contains KPIs and sales effectiveness metrics visual indicators: speedometer gauge, dial, slider, level meter and bullet indicators.
"Sales effectiveness refers to the ability of a company’s sales professionals to “win” at each stage of the customer’s buying process, and ultimately earn the business on the right terms and in the right timeframe.
Improving sales effectiveness is not just a sales function issue; it’s a company issue, as it requires deep collaboration between sales and marketing to understand what’s working and not working, and continuous improvement of the knowledge, messages, skills, and strategies that sales people apply as they work sales opportunities.
Sales effectiveness has historically been used to describe a category of technologies and consulting services aimed at helping companies improve their sales results.
Many companies are creating sales effectiveness functions and have even given people titles such as VP of Sales Effectiveness." [Sales effectiveness. Wikipedia]
The example "Sales metrics and KPIs" was created using the ConceptDraw PRO diagramming and vector drawing software extended with the Meter Dashboard solution from the area "What is a Dashboard" of ConceptDraw Solution Park.
Sales dashboard

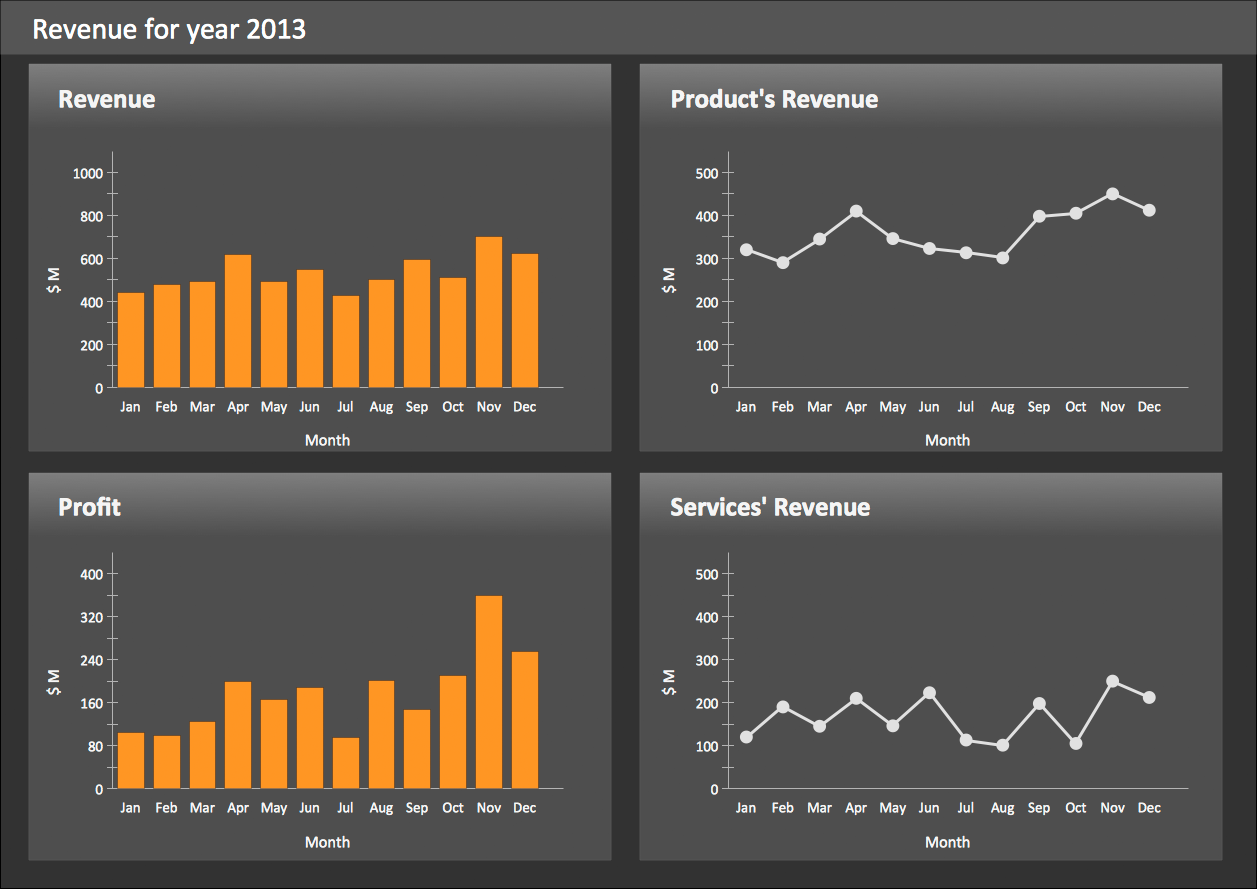
Visualize Sales Data Using Sample Data

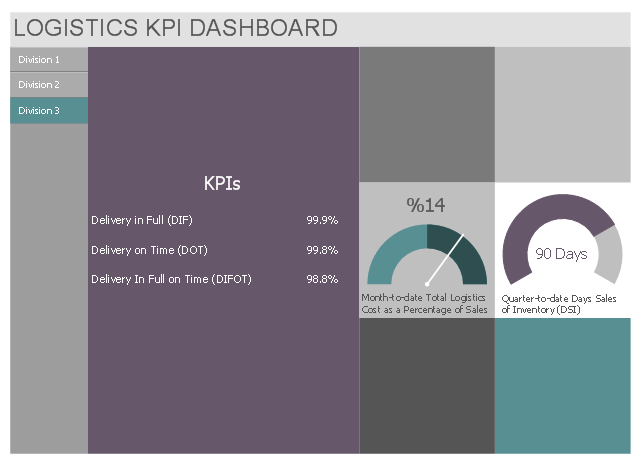
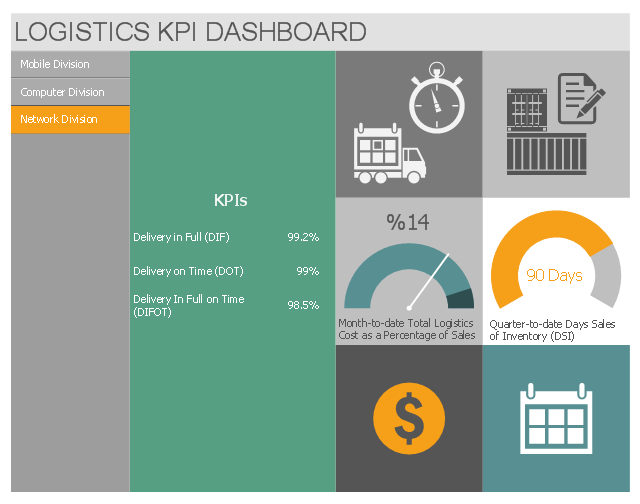
This multipage business dashboard template contains navigation vertical menu and graphic indicators of logistic key performance indicators (KPIs) and business metrics.
Use it to create your logistic KPI dashboard with ConceptDraw PRO software.
The performance dashboard template "Logistics KPI Dashboard" is included in Logistic Dashboard solution from Business Processes area of ConceptDraw Solution Park.
Use it to create your logistic KPI dashboard with ConceptDraw PRO software.
The performance dashboard template "Logistics KPI Dashboard" is included in Logistic Dashboard solution from Business Processes area of ConceptDraw Solution Park.
Division 1
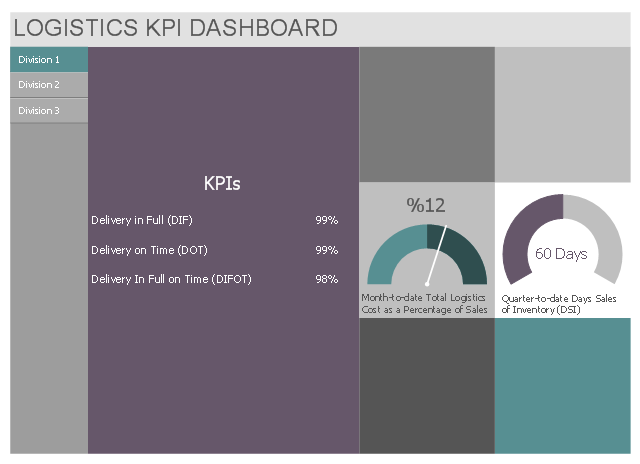
Division 2
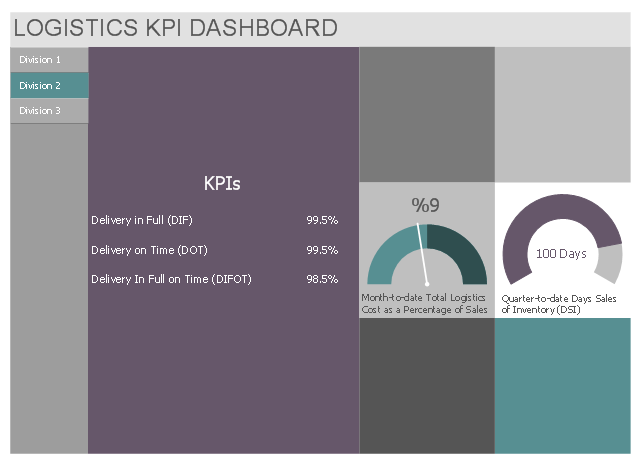
Division 3
What is a KPI?
This multipage business dashboard example shows navigation vertical menu and graphic indicators of logistic key performance indicators (KPIs) and business metrics.
"A performance indicator or key performance indicator (KPI) is a type of performance measurement. KPIs evaluate the success of an organization or of a particular activity in which it engages. Often success is simply the repeated, periodic achievement of some levels of operational goal..., and sometimes success is defined in terms of making progress toward strategic goals. Accordingly, choosing the right KPIs relies upon a good understanding of what is important to the organization." [Performance indicator. Wikipedia]
The performance dashboard example "Logistics KPI Dashboard" was designed using ConceptDraw PRO software extended with Logistic Dashboard solution from Business Processes area of ConceptDraw Solution Park.
Mobile Division
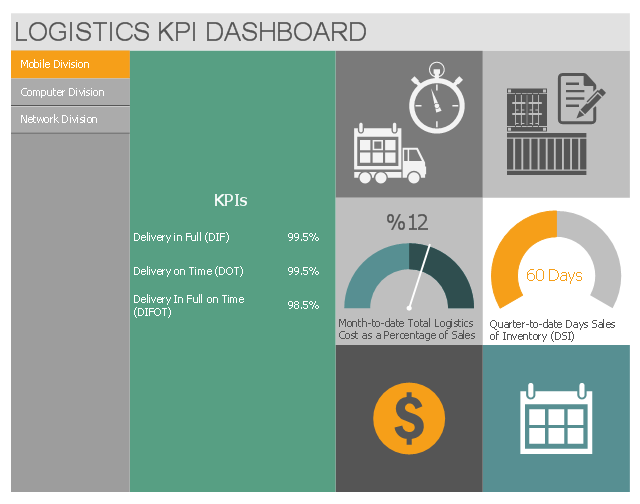
Computer Division
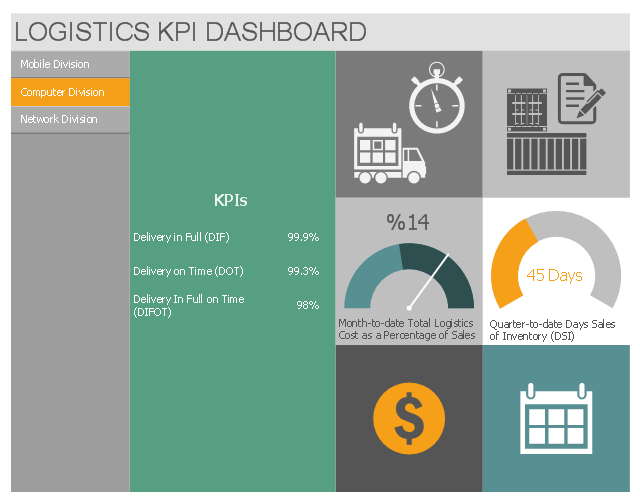
Network Division
- KPIs and Metrics | The Facts and KPIs | A KPI Dashboard | After ...
- KPIs and Metrics | A KPI Dashboard | Sales KPI Dashboards ...
- The Facts and KPIs | KPIs and Metrics | Performance Indicators ...
- Sales Dashboard Template | KPI Dashboard | KPIs and Metrics | Ppt ...
- Design elements - Sales KPIs and metrics
- KPIs and Metrics | Visualize Sales Data Using Sample Data | Sales ...
- KPIs and Metrics | Design elements - Sales KPIs and metrics | TQM ...
- Design elements - Sales KPIs and metrics | KPI Dashboard ...
- Sales metrics and KPIs - Visual dashboard | Sales KPIs ...
- KPIs and Metrics | The Facts and KPIs | KPI Dashboard | Kpis