KPIs and Metrics

A KPI Dashboard

Sales KPI Dashboards

A KPI Dashboard Provides the Answers Your Sales Team

Visualize Sales Data Using Sample Data

Ways You Can Visualize Sales Data

Data Visualization Software Solutions

Constant improvement of key performance indicators

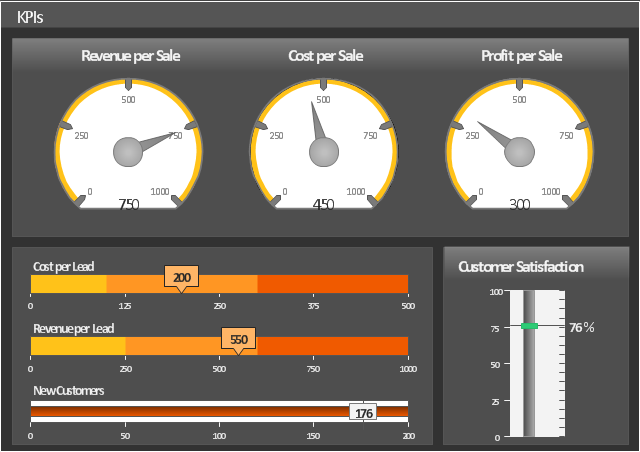
This example was created using ConceptDraw PRO diagramming and vector drawing software extended with Sales Dashboard solution from Marketing area of ConceptDraw Solution Park.
https:/ / www.conceptdraw.com/ solution-park/ marketing-sales-dashboard
This sample indicates sale group effectiveness by different parameters, such as Revenue per Sale, Cost per Sale, Profit per Sale, Customer Satisfaction, Cost per Lead and Revenue per Lead.
https:/ / www.conceptdraw.com/ solution-park/ marketing-sales-dashboard
This sample indicates sale group effectiveness by different parameters, such as Revenue per Sale, Cost per Sale, Profit per Sale, Customer Satisfaction, Cost per Lead and Revenue per Lead.
KPIs
Sales Dashboard Solutions can help your sales team keep an eye on performance

Sales Organization

Data Visualization Solutions

Sales Dashboards for Your Company

Relationships Analysis


- KPIs and Metrics | A KPI Dashboard | Sales KPI Dashboards |
- KPIs and Metrics | Correlation Dashboard | TQM Diagram Tool |
- A KPI Dashboard | A KPI Dashboard Provides the Answers Your ...
- Sales KPI Dashboards | A KPI Dashboard | KPIs and Metrics |
- Sales KPI Dashboards | A KPI Dashboard | KPIs and Metrics |
- KPIs and Metrics | What is a Dashboard Area | PM Dashboards |
- A KPI Dashboard Provides the Answers Your Sales Team
- A KPI Dashboard | A KPI Dashboard Provides the Answers Your ...
- KPIs and Metrics | Spatial Dashboard | Correlation Dashboard |
- Sales KPI Dashboards | A KPI Dashboard Provides the Answers ...
- Cross-functional flowchart Templates portrait, metric | What is a ...
- A KPI Dashboard | Sales KPI Dashboards | A KPI Dashboard ...
- KPIs and Metrics | TQM Diagram Professional Total Quality ...
- Sales KPI Dashboards | A KPI Dashboard Provides the Answers ...
- PM Dashboards | Meter Dashboard | A KPI Dashboard |
- Sales Dashboard Template | Sales KPI Dashboards | Visualize ...
- Constant improvement of key performance indicators | A KPI ...
- PM Dashboards | A KPI Dashboard | Sales KPI Dashboards |
- A KPI Dashboard
- Composition Dashboard | Website KPIs - Visual dashboard ...