KPIs and Metrics

 Business Intelligence Dashboard
Business Intelligence Dashboard solution extends the ConceptDraw DIAGRAM functionality with exclusive tools, numerous ready-to-use vector objects, samples and quick-start templates for creation professional Business Intelligence Dashboards, Business Intelligence Graphics, Business Intelligence Charts and Maps of different kinds. Design easy the BI dashboard, BI model or Dynamic chart in ConceptDraw DIAGRAM to monitor the company's work, to track the indicators corresponding your company's data, to display and analyze key performance indicators, to evaluate the trends and regularities of the processes occurring at the company.
 CRM Center Dashboard
The CRM Center Dashboard solution extends ConceptDraw DIAGRAM functionality with CRM software tools, large collection of CRM Charts live objects, CRM icons, CRM indicators, CRM maps and navigation elements, the set of professionally designed CRM samples and templates to help you construct your own CRM Dashboards and CRM Center Dashboards in a few minutes, to depict the current and actual data by connecting or refreshing the data source file. The customer management software ConceptDraw DIAGRAM makes you free to choose the style for your dashboard and to regulate the quantity of clipart on the diagram according to your taste.
 HR Dashboard
The HR Dashboard solution extends ConceptDraw DIAGRAM functionality with powerful drawing tools and great collection of comprehensive vector design elements, icons, pictograms and objects, navigation elements, live objects of HR charts, HR indicators, and thematic maps. The range of HR Dashboards applications is extensive, among them the human resource management, recruitment, hiring process, human resource development. ConceptDraw DIAGRAM software is perfect for creation HR Dashboard with any goal you need. It gives you all opportunities for designing not only informative, but also professional looking and attractive HR Dashboards of any style and degree of detalization, that are perfect for using in presentations, reports and other thematic documents.
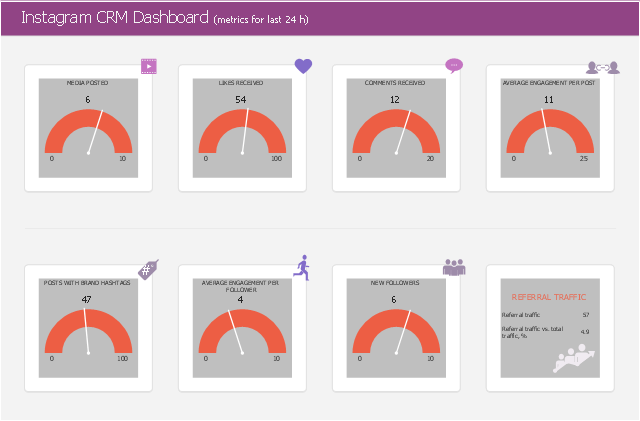
This social media customer service dashboard sample visualizes Instagram CRM business metrics and KPIs using graphic indicators.
"Social CRM metrics in applications.
Metrics for building awareness:
* web traffic
* search volume trends
* volume of followers
* social mentions
Metrics for increasing sales:
* website traffic
* social mentions
* volume of followers
* repeat visits
* social content acceptance rate
Metrics for assessing changes environment in an industry:
* Share of Voice: how much of the overall voice a single brand consumes." [Social CRM. Wikipedia]
The social CRM dashboard example "Instagram CRM Dashboard" was designed using ConceptDraw PRO software extended with CRM Center Dashboard solution from Management area of ConceptDraw Solution Park.
Business dashboard
 Spatial Dashboard
Spatial dashboard solution extends ConceptDraw DIAGRAM software with templates, samples and vector stencils libraries with thematic maps for drawing visual dashboards showing spatial data.
This sale dashboard example contains KPIs and sales effectiveness metrics visual indicators: speedometer gauge, dial, slider, level meter and bullet indicators.
"Sales effectiveness refers to the ability of a company’s sales professionals to “win” at each stage of the customer’s buying process, and ultimately earn the business on the right terms and in the right timeframe.
Improving sales effectiveness is not just a sales function issue; it’s a company issue, as it requires deep collaboration between sales and marketing to understand what’s working and not working, and continuous improvement of the knowledge, messages, skills, and strategies that sales people apply as they work sales opportunities.
Sales effectiveness has historically been used to describe a category of technologies and consulting services aimed at helping companies improve their sales results.
Many companies are creating sales effectiveness functions and have even given people titles such as VP of Sales Effectiveness." [Sales effectiveness. Wikipedia]
The example "Sales metrics and KPIs" was created using the ConceptDraw PRO diagramming and vector drawing software extended with the Meter Dashboard solution from the area "What is a Dashboard" of ConceptDraw Solution Park.
Sales dashboard

 Meter Dashboard
Meter dashboard solution extends ConceptDraw DIAGRAM software with templates, samples and vector stencils library with meter indicators for drawing visual dashboards showing quantitative data.
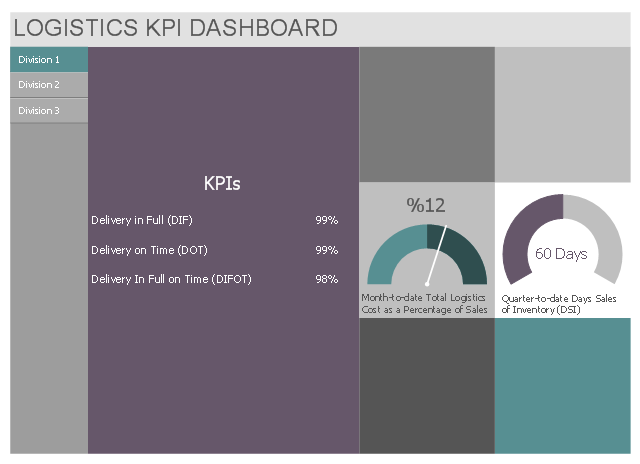
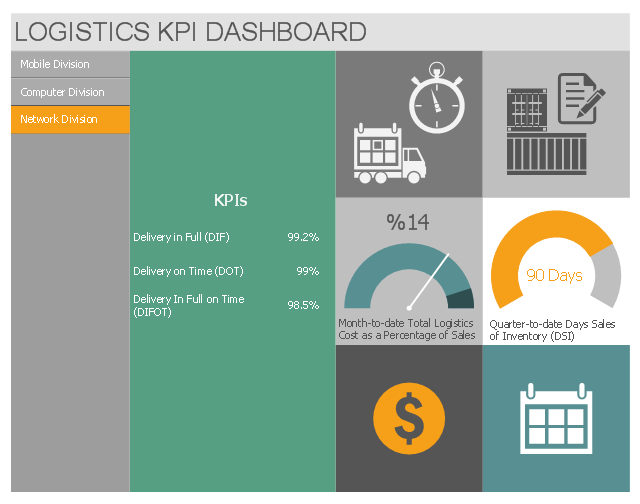
This multipage business dashboard template contains navigation vertical menu and graphic indicators of logistic key performance indicators (KPIs) and business metrics.
Use it to create your logistic KPI dashboard with ConceptDraw PRO software.
The performance dashboard template "Logistics KPI Dashboard" is included in Logistic Dashboard solution from Business Processes area of ConceptDraw Solution Park.
Use it to create your logistic KPI dashboard with ConceptDraw PRO software.
The performance dashboard template "Logistics KPI Dashboard" is included in Logistic Dashboard solution from Business Processes area of ConceptDraw Solution Park.
Division 1
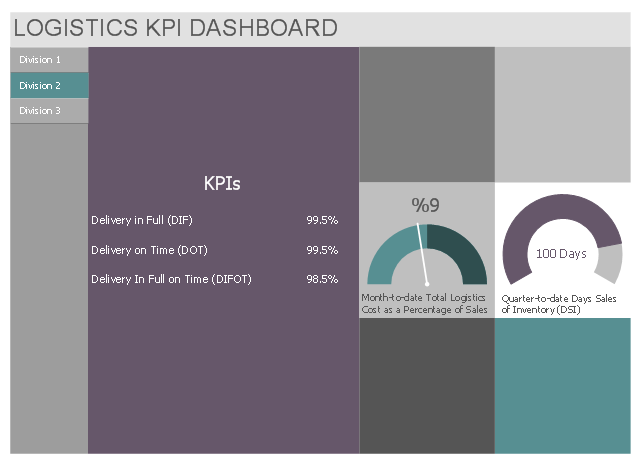
Division 2
Division 3
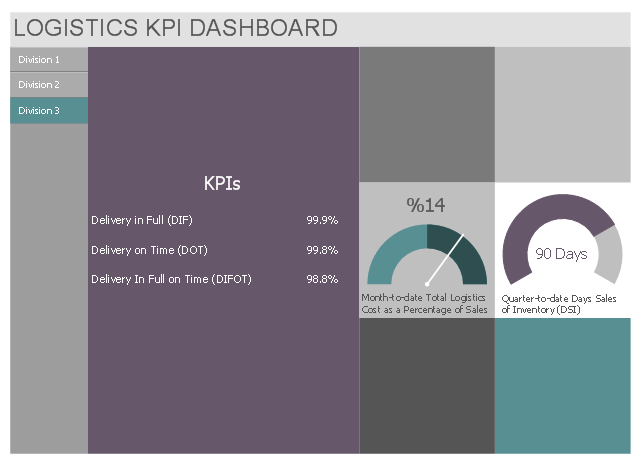
This multipage business dashboard example shows navigation vertical menu and graphic indicators of logistic key performance indicators (KPIs) and business metrics.
"A performance indicator or key performance indicator (KPI) is a type of performance measurement. KPIs evaluate the success of an organization or of a particular activity in which it engages. Often success is simply the repeated, periodic achievement of some levels of operational goal..., and sometimes success is defined in terms of making progress toward strategic goals. Accordingly, choosing the right KPIs relies upon a good understanding of what is important to the organization." [Performance indicator. Wikipedia]
The performance dashboard example "Logistics KPI Dashboard" was designed using ConceptDraw PRO software extended with Logistic Dashboard solution from Business Processes area of ConceptDraw Solution Park.
Mobile Division
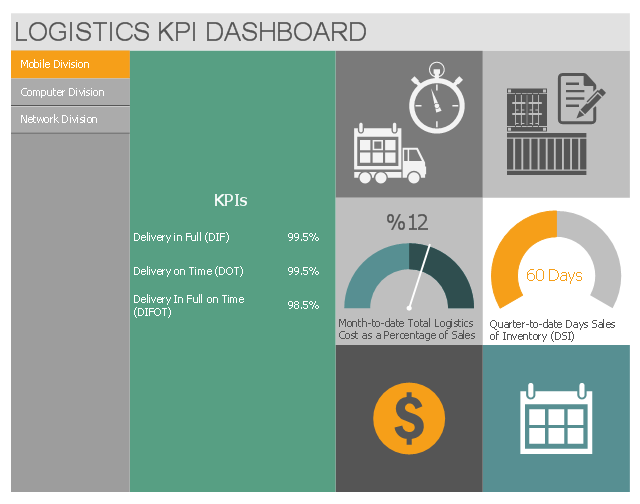
Computer Division
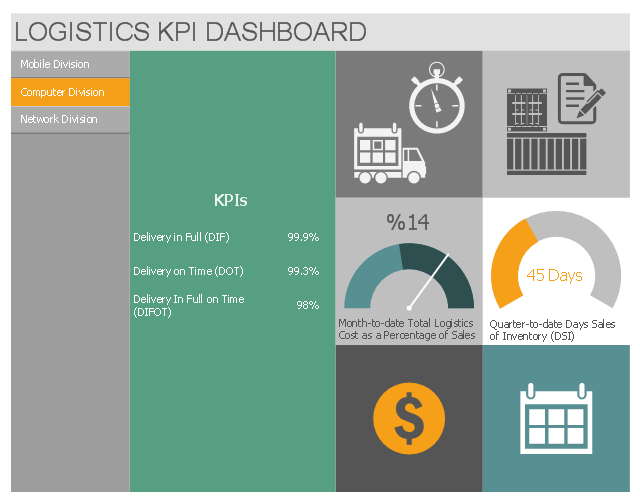
Network Division
 Status Dashboard
Status dashboard solution extends ConceptDraw DIAGRAM software with templates, samples and vector stencils libraries with graphic indicators for drawing the visual dashboards showing status data.
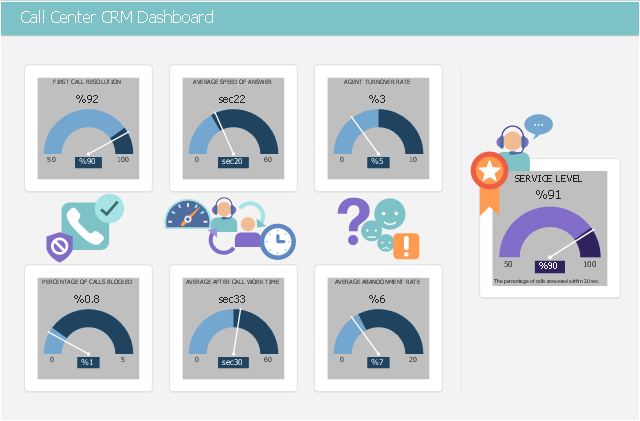
This call centre dashboard sample visualizes CRM business metrics and KPIs using graphic indicators.
"A call centre or call center is a centralised office used for receiving or transmitting a large volume of requests by telephone. An inbound call centre is operated by a company to administer incoming product support or information enquiries from consumers. Outbound call centres are operated for telemarketing, solicitation of charitable or political donations, debt collection and market research. A contact centre is a location for centralised handling of individual communications, including letters, faxes, live support software, social media, instant message, and e-mail. ...
The contact centre is a central point from which all customer contacts are managed. Through contact centres, valuable information about company are routed to appropriate people, contacts to be tracked and data to be gathered. It is generally a part of company’s customer relationship management." [Call centre. Wikipedia]
The customer relationship management dashboard example "Call Center CRM Dashboard" was designed using ConceptDraw PRO software extended with CRM Dashboard solution from Management area of ConceptDraw Solution Park.
Business dashboard
HelpDesk
How to Make Business Intelligence Dashboard

 Logistic Dashboard
The powerful tools of Logistic Dashboard solution and specially developed live graphic objects of logistic icons, logistic navigation elements, logistic indicators, logistic charts and logistic maps effectively assist in designing Logistic dashboards, Logistic maps, Logistic charts, diagrams and infographics. The included set of prebuilt samples and quick-start templates, demonstrates the power of ConceptDraw DIAGRAM software in logistics management, its assisting abilities in development, realization and analyzing the logistic processes, as well as in perfection the methods of logistics management.
This sales performance dashboard example includes KPIs indicators and business metrics charts: bullet indicator - "Win Ratio vs. Last Year", gauge (speedometer) indicators - "Open Deals vs. Last Year" and "YTD Sales vs. Last Year", column chart - "Leads created", line chart - "Opportunities Won", alarm indicators - "Sales Ratios", horizontal bar chart - "Top Products in Revenue".
The example "Sales performance dashboard" was created using the ConceptDraw PRO diagramming and vector drawing software extended with the Sales Dashboard solution from the Marketing area of ConceptDraw Solution Park.
www.conceptdraw.com/ solution-park/ marketing-sales-dashboard
The example "Sales performance dashboard" was created using the ConceptDraw PRO diagramming and vector drawing software extended with the Sales Dashboard solution from the Marketing area of ConceptDraw Solution Park.
www.conceptdraw.com/ solution-park/ marketing-sales-dashboard
Sales dashboard

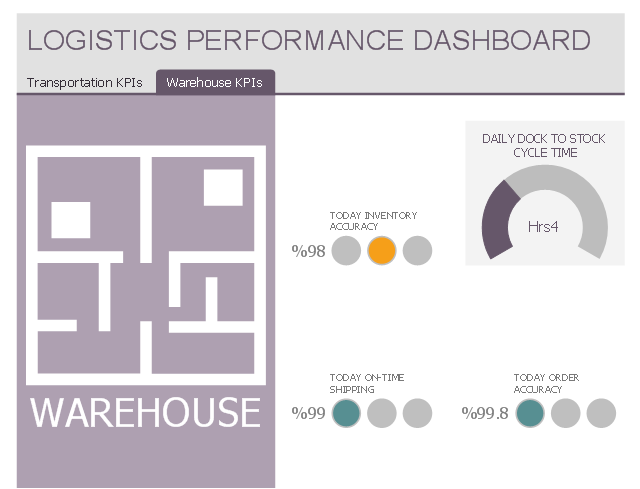
This multipage performance dashboard example shows navigation tab set and graphic indicators of logistic key performance indicators (KPIs) and business metrics.
"Dashboards often provide at-a-glance views of KPIs (key performance indicators) relevant to a particular objective or business process (e.g. sales, marketing, human resources, or production)." [Dashboard (business). Wikipedia]
The business dashboard example "Logistics Performance Dashboard" was designed using ConceptDraw PRO software extended with Logistic Dashboard solution from Business Processes area of ConceptDraw Solution Park.
Transportation KPIs
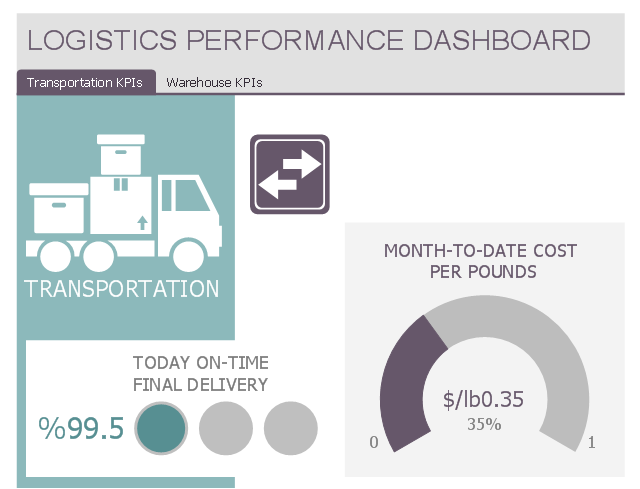
Warehouse KPIs
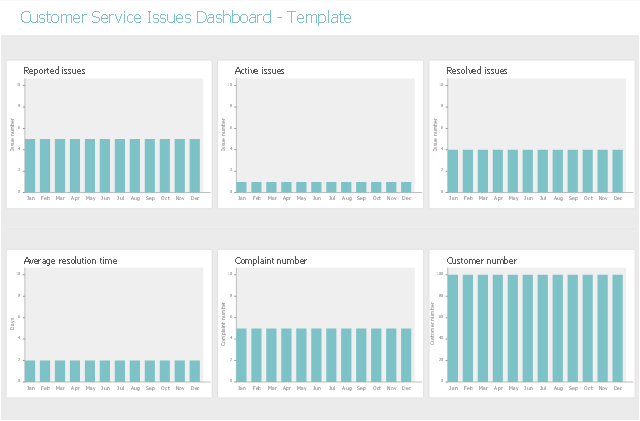
This customer service dashboard template uses column charts to visualize CRM business metrics and KPIs: Reported issues, Active issues, Resolved issues, Average resolution time, Complaint number, Customer number.
To set data source file for graphic indicator use Action menu.
Use this template to design your CRM dashboard with ConceptDraw PRO software.
The CRM dashboard template "Customer Service Issues Dashboard - Template" is included in CRM Center Dashboard solution from Management area of ConceptDraw Solution Park.
Business dashboard
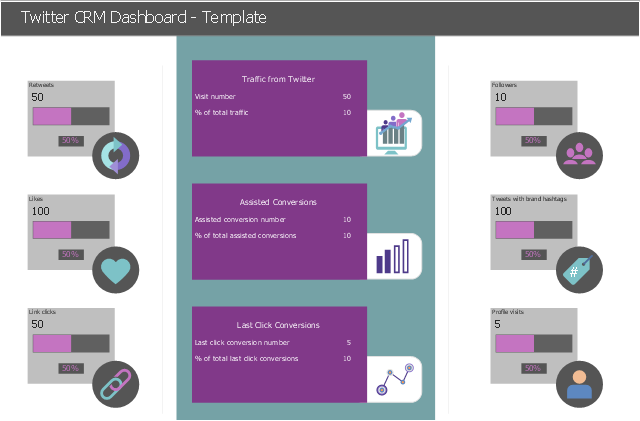
This social media customer service dashboard template uses graphic indicators (Level indicator and Multi digital values) to visualize Twitter CRM business metrics and KPIs: Retweets, Likes, Followers, Link clicks, Tweets with brand hashtags, Traffic from Twitter, Assisted Conversions, Last Click Conversions, Profile visits.
To set data source file for graphic indicator use Action menu.
Use this template to design your Twitter CRM dashboard with ConceptDraw PRO software.
The social CRM dashboard template "Twitter CRM Dashboard - Template" is included in CRM Center Dashboard solution from Management area of ConceptDraw Solution Park.
Business dashboard
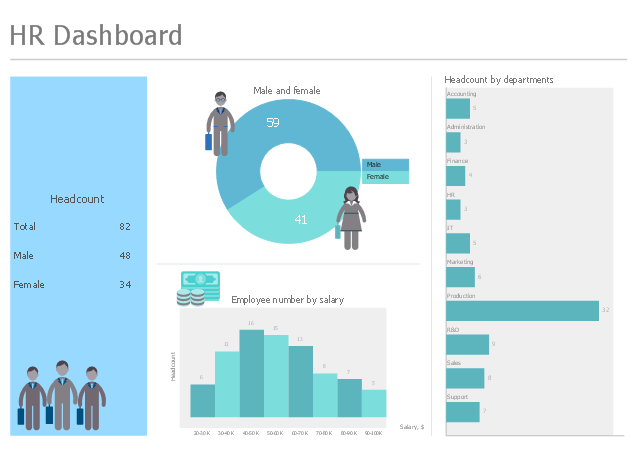
This HR dashboard sample shows business metrics and KPIs for human resources management: headcount, male and female ratio, employee distribution by salary, headcount by departments.
"Human Resource Management (HRM or HR) is the management of human resources. It is designed by the HR Department to maximize employee performance in service of an employer's strategic objectives. HR is primarily concerned with the management of people within organizations, focusing on policies and on systems. HR departments are responsible for overseeing employee-benefits design, employee recruitment, training and development, performance appraisal, and rewarding (e.g., managing pay and benefit systems)." [Human resource management. Wikipedia]
The human resources dashboard example "HR Dashboard" was designed using ConceptDraw PRO software extended with HR Dashboard solution from Management area of ConceptDraw Solution Park.
Human resources dashboard
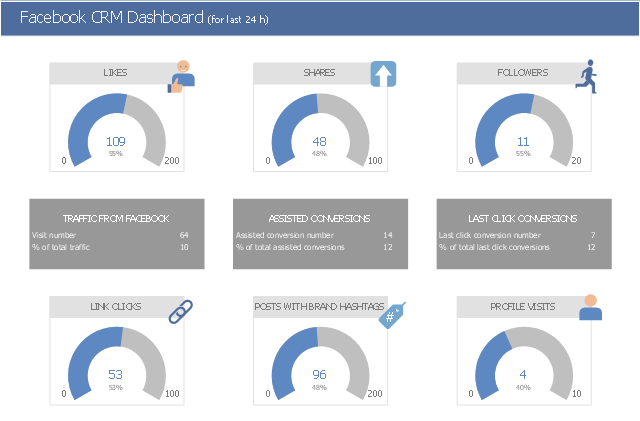
This social media customer service dashboard sample visualizes CRM business metrics and KPIs using graphic indicators.
"Social CRM (customer relationship management) is use of social media services, techniques and technology to enable organizations to engage with their customers. ...
Social CRM has applications in marketing, customer service and sales, including:
* Social Engagement with prospects...
* Social Customer Service...
* Personalized Marketing Strategy" [Social CRM. Wikipedia]
The social CRM dashboard example "Facebook CRM Dashboard" was designed using ConceptDraw PRO software extended with CRM Center Dashboard solution from Management area of ConceptDraw Solution Park.
Business dashboard
- KPI Dashboard | KPIs and Metrics | Business Graphics Software ...
- How To Create an HR Metric Dashboard | KPIs and Metrics ...
- KPIs and Metrics | The Facts and KPIs | A KPI Dashboard | After ...
- Sales KPI Dashboards | KPIs and Metrics | Reporting Dashboard ...
- KPIs and Metrics | Sales KPIs and Metrics - Vector stencils library | A ...
- Sales metrics and KPIs - Visual dashboard | Sales KPIs ...
- HR Metrics Dashboard | HR Dashboard | Enterprise dashboard | Hr ...
- Design elements - Sales KPIs and metrics | KPIs and Metrics | HR ...
- The Facts and KPIs | Logistics KPI Dashboard - Template | A KPI ...
- KPI Dashboard | A KPI Dashboard | Logistics KPI Dashboard ...
- Sales dashboard - Vector stencils library | Sales metrics and KPIs ...
- Performance Indicators | Design elements - Sales KPIs and metrics ...
- Meter indicators 2 - Vector stencils library | Design elements - Meter ...
- KPI Dashboard | Performance Indicators | Sales Dashboard | Key ...
- Sales metrics and KPIs - Visual dashboard | Sales dashboard ...
- Business Report Pie. Pie Chart Examples | Composition Dashboard ...
- Website metrics - Visual dashboard
- Performance Indicators | Design elements - Sales KPIs and metrics ...
- Sales Dashboard Template | Logistic Dashboard | Logistics and ...
- Logistics Performance Dashboard - Template | Sales KPIs ...