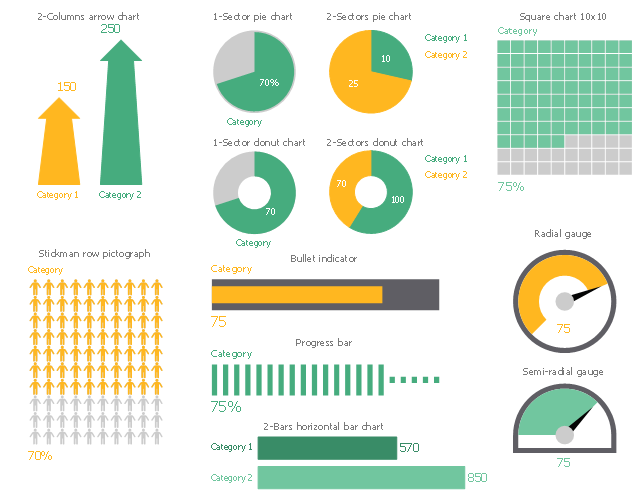
The vector stencils library "Sales KPIs and Metrics" contains 15 chart templates and graphic indicators of sales key performance indicators (KPIs) and metrics for drawing sales dashboards: line charts "Cost per order" and "Clicks from Sales Follow-Up Emails", column charts "Social Media Usage" and "Usage Rate of Marketing Collateral", horizontal bar charts "Rate of Follow Up Contact", "Cost per customer" and "Lead Response Time", pie charts "Product mix", "Product Performance" and "Rate of Contact", gauge (speedometer) indicators "Sales Growth" and "Actual vs Plan", bullet indicator "Sales Target", diamond alarm indicators "Average Purchase Value", "Quote to Close Ratio", "Opportunity-to-Win Ratio" and "Sales Ratio".
The dashboard charts and indicators example "Design elements - Sales KPIs and metrics" for the ConceptDraw PRO diagramming and vector drawing software is included in the Sales Dashboard solution from the Marketing area of ConceptDraw Solution Park.
www.conceptdraw.com/ solution-park/ marketing-sales-dashboard
Sales dashboard charts and graphic indicators

KPIs and Metrics

 HR Dashboard
The HR Dashboard solution extends ConceptDraw PRO functionality with powerful drawing tools and great collection of comprehensive vector design elements, icons, pictograms and objects, navigation elements, live objects of HR charts, HR indicators, and thematic maps. The range of HR Dashboards applications is extensive, among them the human resource management, recruitment, hiring process, human resource development. ConceptDraw PRO software is perfect for creation HR Dashboard with any goal you need. It gives you all opportunities for designing not only informative, but also professional looking and attractive HR Dashboards of any style and degree of detalization, that are perfect for using in presentations, reports and other thematic documents.
Performance Indicators

 Sales Dashboard
Sales Dashboard solution extends ConceptDraw PRO software with templates, samples and library of vector stencils for drawing the visual dashboards of sale metrics and key performance indicators (KPI).
 CRM Center Dashboard
The CRM Center Dashboard solution extends ConceptDraw PRO v10 functionality with CRM software tools, large collection of CRM Charts live objects, CRM icons, CRM indicators, CRM maps and navigation elements, the set of professionally designed CRM samples and templates to help you construct your own CRM Dashboards and CRM Center Dashboards in a few minutes, to depict the current and actual data by connecting or refreshing the data source file. The customer management software ConceptDraw PRO makes you free to choose the style for your dashboard and to regulate the quantity of clipart on the diagram according to your taste.
The vector stencils library "Financial indicators" contains 12 graphic indicators.
Graphic indicators visualize status information and business metrics as easy to understand pictures.
Use it to design your financial infographics.
Graphic indicators visualize status information and business metrics as easy to understand pictures.
Use it to design your financial infographics.
Infographic elements
The vector stencils library "Meter indicators" contains 29 Live Objects: speedometer gauge, dial, bullet graph, slider and level meter visual indicators.
The Live Objects designed to display actual measures of performance metrics and KPIs from external data source files.
Some of them also display comparative measures, and colored zones of qualitative ranges with legend.
Use it to draw business performance dashboards using the ConceptDraw PRO diagramming and vector drawing software .
"Digital dashboards may be laid out to track the flows inherent in the business processes that they monitor. Graphically, users may see the high-level processes and then drill down into low level data. This level of detail is often buried deep within the corporate enterprise and otherwise unavailable to the senior executives. ...
Specialized dashboards may track all corporate functions. Examples include human resources, recruiting, sales, operations, security, information technology, project management, customer relationship management and many more departmental dashboards. ...
Like a car's dashboard (or control panel), a software dashboard provides decision makers with the input necessary to "drive" the business. Thus, a graphical user interface may be designed to display summaries, graphics (e.g., bar charts, pie charts, bullet graphs, "sparklines," etc.), and gauges (with colors similar to traffic lights) in a portal-like framework to highlight important information. ...
Digital dashboards allow managers to monitor the contribution of the various departments in their organization. To gauge exactly how well an organization is performing overall, digital dashboards allow you to capture and report specific data points from each department within the organization, thus providing a "snapshot" of performance." [Dashboard (management information systems). Wikipedia]
The example "Design elements - Meter indicators" is included in the Meter Dashboard solution from the area "What is a Dashboard" of ConceptDraw Solution Park.
Visual indicators

 Business Intelligence Dashboard
Business Intelligence Dashboard solution extends the ConceptDraw PRO v11 functionality with exclusive tools, numerous ready-to-use vector objects, samples and quick-start templates for creation professional Business Intelligence Dashboards, Business Intelligence Graphics, Business Intelligence Charts and Maps of different kinds. Design easy the BI dashboard, BI model or Dynamic chart in ConceptDraw PRO to monitor the company's work, to track the indicators corresponding your company's data, to display and analyze key performance indicators, to evaluate the trends and regularities of the processes occurring at the company.
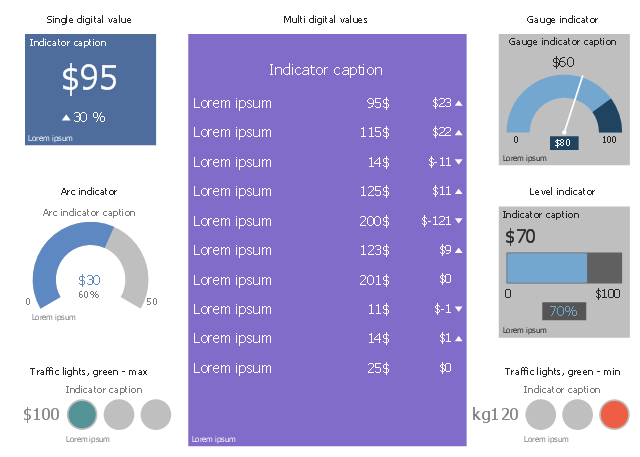
The vector stencils library "CRM indicators" contains 7 graphic indicators: single digital value indicator, multi digital value indicator, gauge, level indicator, traffic lights.
Use it to visualize business metrics and KPIs on your CRM center dashboards with ConceptDraw PRO software.
The graphic indicators example "Design elements - CRM indicators" is included in CRM Dashboard solution from Management area of ConceptDraw Solution Park.
Use it to visualize business metrics and KPIs on your CRM center dashboards with ConceptDraw PRO software.
The graphic indicators example "Design elements - CRM indicators" is included in CRM Dashboard solution from Management area of ConceptDraw Solution Park.
Dashboard stencils
- Design elements - Sales KPIs and metrics | The Facts and KPIs | KPI ...
- Design elements - Sales KPIs and metrics | Performance Indicators ...
- Design elements - Sales KPIs and metrics | Salesforce Metric ...
- Design elements - Sales KPIs and metrics | Competitor Analysis ...
- Sales KPIs and Metrics - Vector stencils library | Design elements ...
- Design elements - Sales KPIs and metrics
- KPIs and Metrics | Design elements - Sales KPIs and metrics | TQM ...
- Meter indicators 2 - Vector stencils library | Design elements - Meter ...
- Performance Indicators | Design elements - Sales KPIs and metrics ...
- Sales Process Flowchart Symbols | Design elements - Sales KPIs ...