Chart Maker for Presentations
Easy charting software comes with beautiful chart templates and examples. This makes it easy to create professional charts without prior experience.Flowcharts
The Flowcharts solution for ConceptDraw DIAGRAM is a comprehensive set of examples and samples in several varied color themes for professionals that need to represent graphically a process. Solution value is added by the basic flow chart template and shapes' libraries of flowchart notation. ConceptDraw DIAGRAM flow chart creator lets one depict the processes of any complexity and length, as well as design the Flowchart either vertically or horizontally.
Flowchart
With ConceptDraw DIAGRAM it is easy to create professional flowchart diagrams of any complexity. With the use of numerous templates and the extensive libraries of ready-made symbols and blocks; depicting your business processes has never been easier.Cross-Functional Flowcharts
Cross-functional flowcharts are powerful and useful tool for visualizing and analyzing complex business processes which requires involvement of multiple people, teams or even departments. They let clearly represent a sequence of the process steps, the order of operations, relationships between processes and responsible functional units (such as departments or positions).
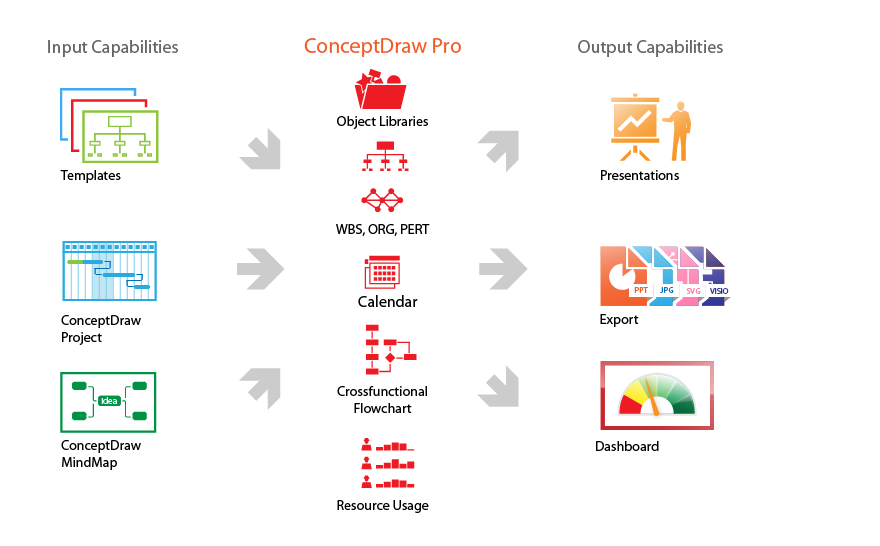
Product Overview
ConceptDraw DIAGRAM offers a wide choice of powerful and easy-to-use tools for quickly creating all kinds of charts and diagrams. Even if you've never used a drawing tool before, it's very easy to create high-quality professional graphic documents with ConceptDraw DIAGRAM.ConceptDraw DIAGRAM Database Modeling Software
ConceptDraw DIAGRAM is a very easy-to-use and intuitive database design tool which can save you hundreds of work hours. See database diagram samples created with ConceptDraw DIAGRAM database modeling database diagram software.Venn Diagram Template for Word
This template shows the Venn Diagram. It was created in ConceptDraw DIAGRAM diagramming and vector drawing software using the ready-to-use objects from the Venn Diagrams Solution from the "Diagrams" area of ConceptDraw Solution Park.Venn Diagram Examples for Problem Solving. Venn Diagram as a Truth Table
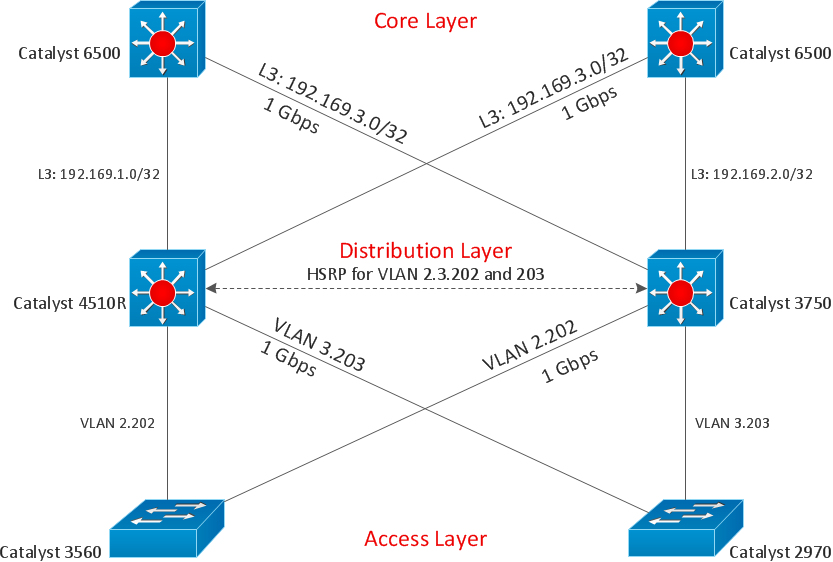
Venn diagrams are illustrations used in the branch of mathematics known as set theory. They show the mathematical or logical relationship between different groups of things (sets). A Venn diagram shows all the possible logical relations between the sets.Cisco Design
Cisco Network Diagrams solution from the Computer and Networks area of ConceptDraw Solution Park provides 14 libraries with 450 ready-to-use predesigned vector objects that can be used for quickly and easily drawing the professional Cisco Network Diagrams.Circles Venn Diagram
This example shows the 4 Circle Venn Diagram. The Venn Diagram visualizes all possible logical relations between several sets. The sets are represented as circles on the Venn Diagram. On this example you can see the intersections of 4 sets. Venn Diagrams are widely used in mathematics, logic, statistics, marketing, sociology, etc.Basic Circles Venn Diagram. Venn Diagram Example
Venn Diagrams visualize all possible logical relations between several sets and are widely used in mathematics, logic, statistics, marketing, sociology, etc.This Venn Diagram shows the relative complement of the set A with respect to the set B. It is the set of the elements in B, but not in A. In other words it is the set-theoretic difference B-A.
Multi Layer Venn Diagram. Venn Diagram Example
To visualize the relationships between subsets of the universal set you can use Venn diagrams. To construct one, you should divide the plane into a number of cells using n figures. Each figure in the chart represents a single set of, and n is the number of represented sets. Splitting is done in a way that there is one and only one cell for any set of these figures, the points of which belong to all the figures from the set and do not belong to others. The plane on which the figures are represented, is the universal set U. Thus, the point which does not belong to any of the figures, belongs only to U.3 Circle Venn Diagram. Venn Diagram Example
This template shows the Venn Diagram. It was created in ConceptDraw DIAGRAM diagramming and vector drawing software using the ready-to-use objects from the Venn Diagrams Solution from the "Diagrams" area of ConceptDraw Solution Park.Venn Diagrams visualize all possible logical intersections between several sets and are widely used in mathematics, logic, statistics, marketing, sociology, etc.
2 Circle Venn Diagram. Venn Diagram Example
Using the ready-to-use predesigned objects, samples and templates from the Venn Diagrams Solution for ConceptDraw DIAGRAM you can create your own professional looking Venn Diagrams quick and easy.Venn Diagram Examples for Problem Solving. Environmental Social Science. Human Sustainability Confluence
The Venn diagram example below shows sustainable development at the confluence of three constituent parts.Create your Venn diagrams for problem solving in environmental social science using the ConceptDraw DIAGRAM diagramming and vector drawing software extended with the Venn Diagrams solution from the area "Diagrams" of ConceptDraw Solution Park.
Event-driven Process Chain Diagrams
Event-Driven Process Chain Diagrams solution extends ConceptDraw DIAGRAM functionality with event driven process chain templates, samples of EPC engineering and modeling the business processes, and a vector shape library for drawing the EPC diagrams and EPC flowcharts of any complexity. It is one of EPC IT solutions that assist the marketing experts, business specialists, engineers, educators and researchers in resources planning and improving the business processes using the EPC flowchart or EPC diagram. Use the EPC solutions tools to construct the chain of events and functions, to illustrate the structure of a business process control flow, to describe people and tasks for execution the business processes, to identify the inefficient businesses processes and measures required to make them efficient.
Applications
ConceptDraw DIAGRAM is a multipurpose software for business and technical drawing, diagramming, visual documentating.To understand what practical benefits you can reach with ConceptDraw DIAGRAM take a look at this range of articles. They describe the versatile possibilities of ConceptDraw DIAGRAM expedient applications.
Venn Diagram Examples for Problem Solving. Computer Science. Chomsky Hierarchy
A Venn diagram, sometimes referred to as a set diagram, is a diagramming style used to show all the possible logical relations between a finite amount of sets. In mathematical terms, a set is a collection of distinct objects gathered together into a group, which can then itself be termed as a single object. Venn diagrams represent these objects on a page as circles or ellipses, and their placement in relation to each other describes the relationships between them.The Venn diagram example below visualizes the the class of language inclusions described by the Chomsky hierarchy.
Flowchart Software
Flowchart is widely used in business, education and economic presentations to help the audience visualize the content better, or to find flaws in a process flow diagrams. Flowcharts are particularly useful for displaying how a process currently flow or could ideally function. Flowcharts can help you see whether the steps of a process are logical, uncover problems or miscommunications, define the boundaries of a process, and develop a common base of knowledge about a process.ConceptDraw DIAGRAM flowchart software will help to quickly create new flowcharts, workflow, NS Diagram, BPMN Diagram, Cross-functional flowcharts, data flow diagrams and highlight flowcharts.
Feature-rich flowchart maker, free thousand flowchart examples and templates and colored symbols that will allow you to create professional looking flowcharts simply.
ConceptDraw DIAGRAM supports macOS and Windows.
Venn Diagram Examples for Problem Solving
In the Venn Diagrams solution, there are the pre-made examples that can be always used for making the unique, great looking diagrams, such as the 2-set Venn ones of any needed colour, the 3-set one, the 4-set ones and the 5-set ones. Having the already previously created samples of the Venn diagrams can help any ConceptDraw DIAGRAM user make it possible to make the needed drawing within only a few minutes by editing the existing ones.- Circle-spoke diagram template - Target market | Marketing ...
- Organizational Structure | Data structure diagram with ConceptDraw ...
- The Best Mac Software for Diagramming or Drawing | Universal ...
- Universal Diagramming Area | Applications | Flow process chart |
- Business diagrams & Org Charts with ConceptDraw PRO | Audio ...
- ConceptDraw PRO The best Business Drawing Software | Business ...
- Data Flow Diagrams | Software and Database Design with ...
- ConceptDraw PRO The best Business Drawing Software | The Best ...
- ConceptDraw PRO Database Modeling Software | Data Flow ...
- Best Vector Drawing Application for Mac OS X | Vector graphics ...
- ConceptDraw Solution Park | Business diagrams & Org Charts with ...
- ConceptDraw PRO The best Business Drawing Software | UML ...
- ConceptDraw PRO The best Business Drawing Software ...
- Universal Diagramming Area | Enhancing maps using ConceptDraw ...
- Organizational Structure | ConceptDraw PRO - Organizational chart ...
- ConceptDraw PRO Compatibility with MS Visio | Computer and ...
- ConceptDraw PRO The best Business Drawing Software | Technical ...
- ConceptDraw PRO The best Business Drawing Software ...
- Target and Circular Diagrams | Business diagrams & Org Charts ...
- Data Flow Diagrams | ConceptDraw PRO The best Business ...
- ERD | Entity Relationship Diagrams, ERD Software for Mac and Win
- Flowchart | Basic Flowchart Symbols and Meaning
- Flowchart | Flowchart Design - Symbols, Shapes, Stencils and Icons
- Flowchart | Flow Chart Symbols
- Electrical | Electrical Drawing - Wiring and Circuits Schematics
- Flowchart | Common Flowchart Symbols