Draw Fishbone Diagram on MAC Software
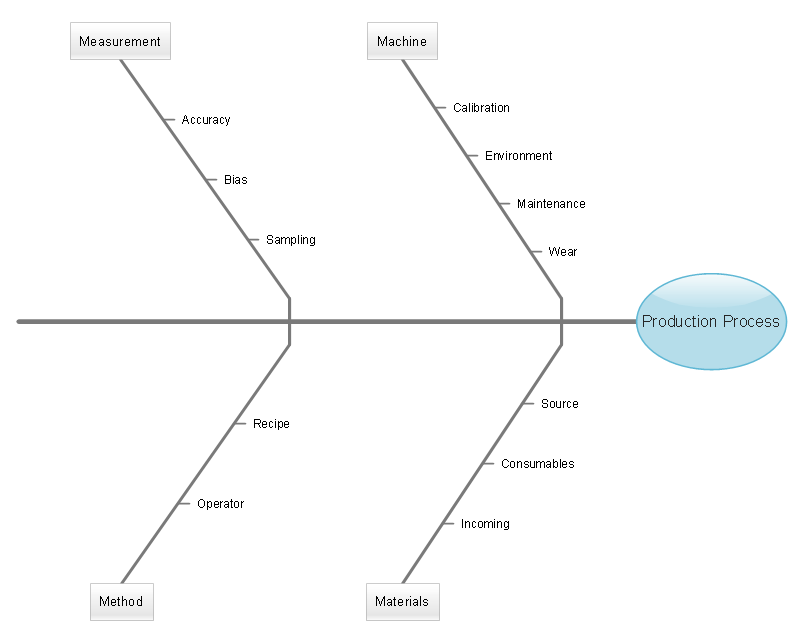
A Fishbone Diagram, also known as Ishikawa Diagram and a Cause and Effect Diagram, is a way of visualizing and categorizing the potential causes of any problem to be able to identify the root causes this problem. In this diagram you mention the System itself, the Suppliers, Surroundings, Skills as main parts of it as well as its sub-causes which lead to one main Service Problem. To be able to create such diagram you need the right software to use for drawing the professionally looking sophisticated diagram and the solution can be using ConceptDraw DIAGRAM as the best of existing applications for making such flowcharts. The variety of symbols and vector elements in it will please anyone and so it will simplify your work. Making different smart charts in terms of having good impression among your colleagues, chiefs and clients as well as progressing with your work, you can rely upon software called ConceptDraw DIAGRAM as the one being your best assistant and adviser which you can have on your Mac.Flowchart Program Mac . Create Flowcharts & Diagrams . Business
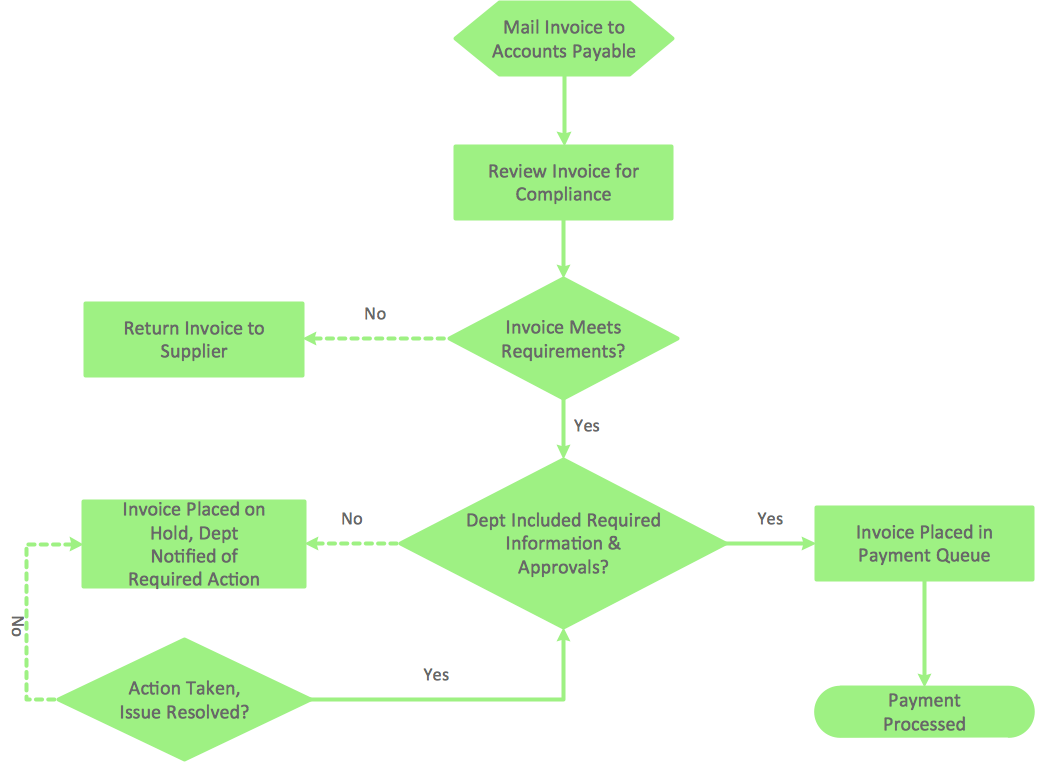
Flowchart - Invoice payment processCause and Effect Analysis - Fishbone Diagrams for Problem Solving
Cause and Effect Analysis - Fishbone Diagrams for Problem SolvingPROBLEM ANALYSIS . Identify and Structure Factors
Identify and Structure Factors. Affinity diagram - Implementing continuous process improvementThe Best Mac Software for Diagramming or Drawing. Draw
Concept map - Internet marketingSWOT Analysis Software
SWOT analysis is well known for its opportunity to illustrate Strengths, Weaknesses, Opportunities and Threats of organizations, companies and businesses and is being world widely used by many specialists as it is a very useful tool to determine the problems in each field of activity in order to get rid of it and to succeed in what you do. Having ConceptDraw DIAGRAM software means having a chance to make this SWOT matrix in only a few minutes as we provide our clients with all necessary tools for making their charts, flowcharts, diagrams, plans and schemes looking amazing: very smart, professional, making an impression of them being specialists if even they never had a chance to create anything similar before. Our SWOT Analysis solution supports a variation of SWOT analysis called TOWS which is more focused on external factors and action planning. But no matter which matrix you decide to draw, we will help you to do that once you use ConceptDraw DIAGRAM.Visio Look a Like Diagrams . Connect Everything. ConceptDraw
Visio Look a Like DiagramsWhat can you create with ConceptDraw MINDMAP?. For Macintosh
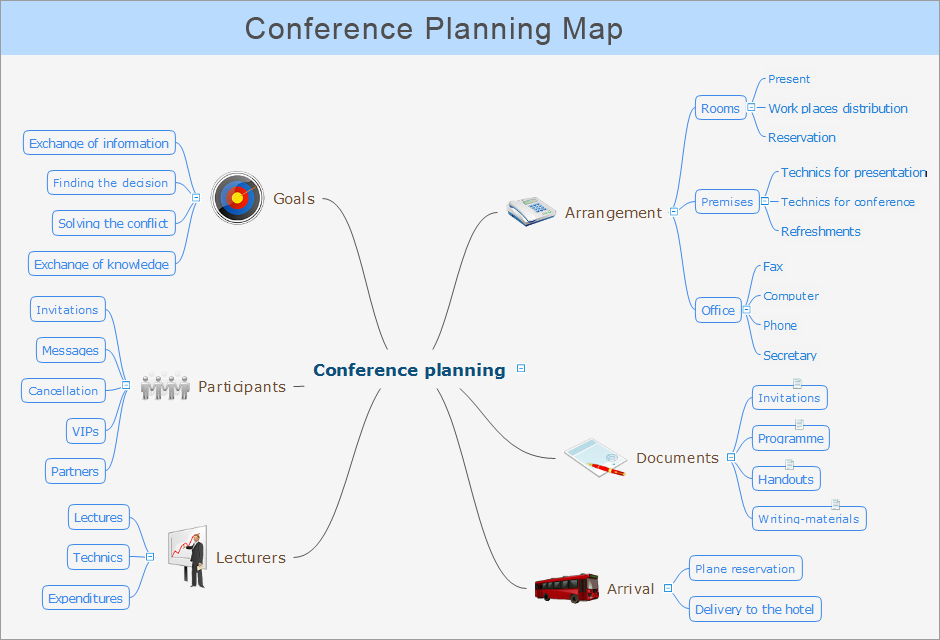
Idea Communication - Conference PlanningLogical Network Diagram . Quickly Create Professional LAN
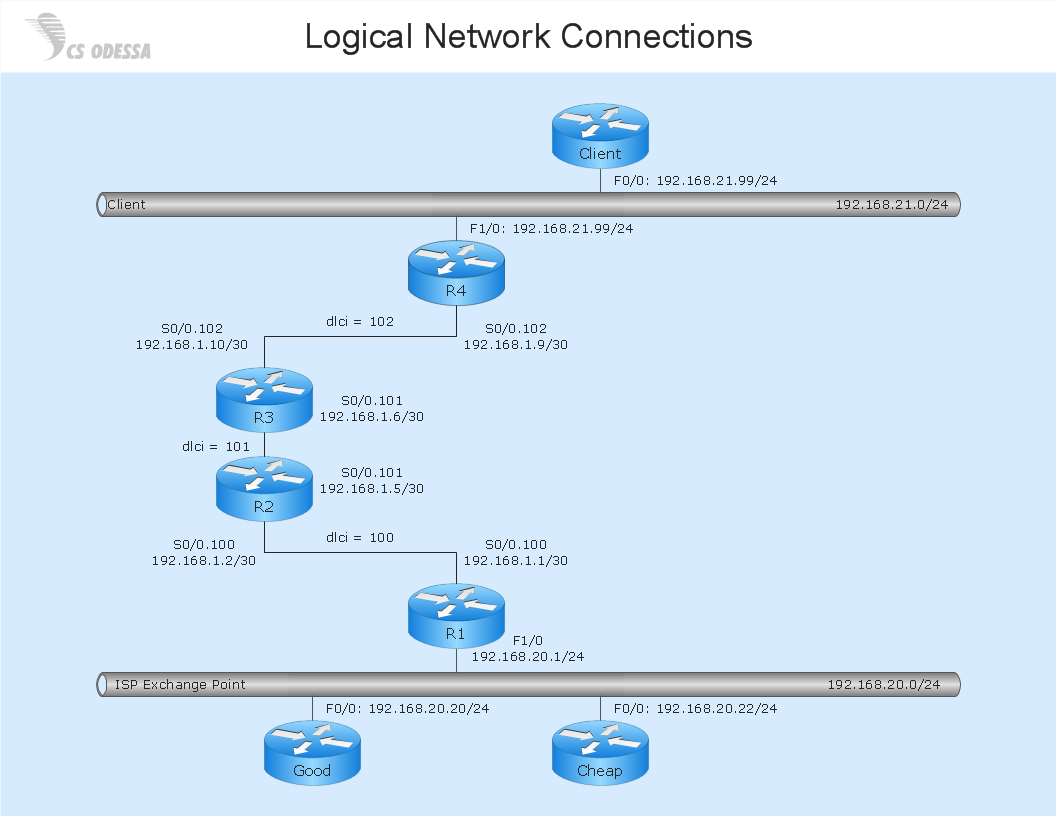
Logical network connections diagram - Computer and networks solution sampleDiagrama de Topologia. Connect Everything. ConceptDraw
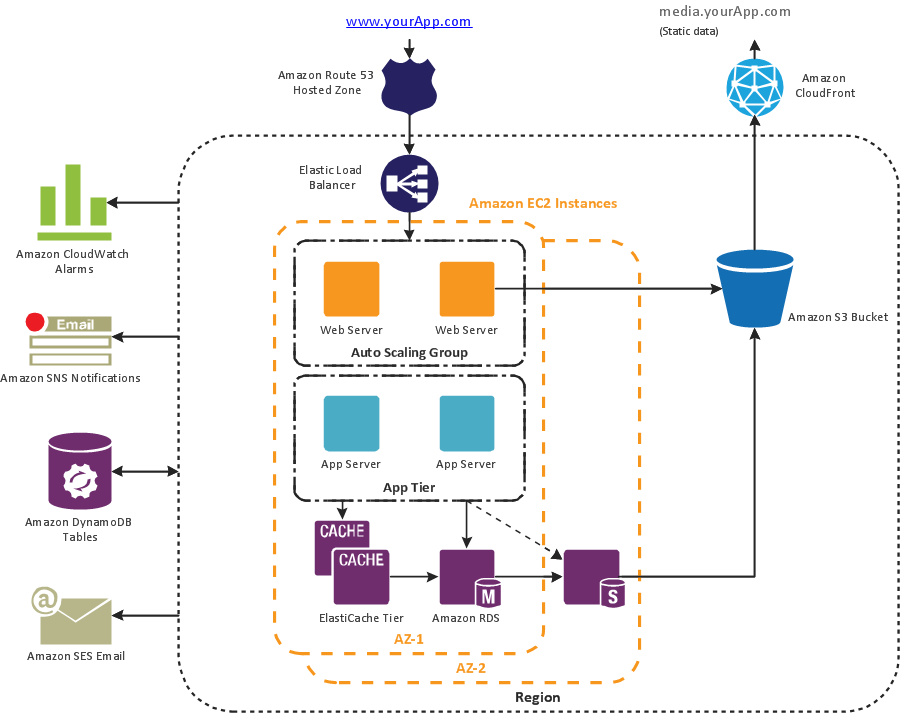
Amazon Web Services (AWS) diagram - 3 Tier auto scalable Web application architectureRemote Networking Diagrams. Quickly Create Professional Remote
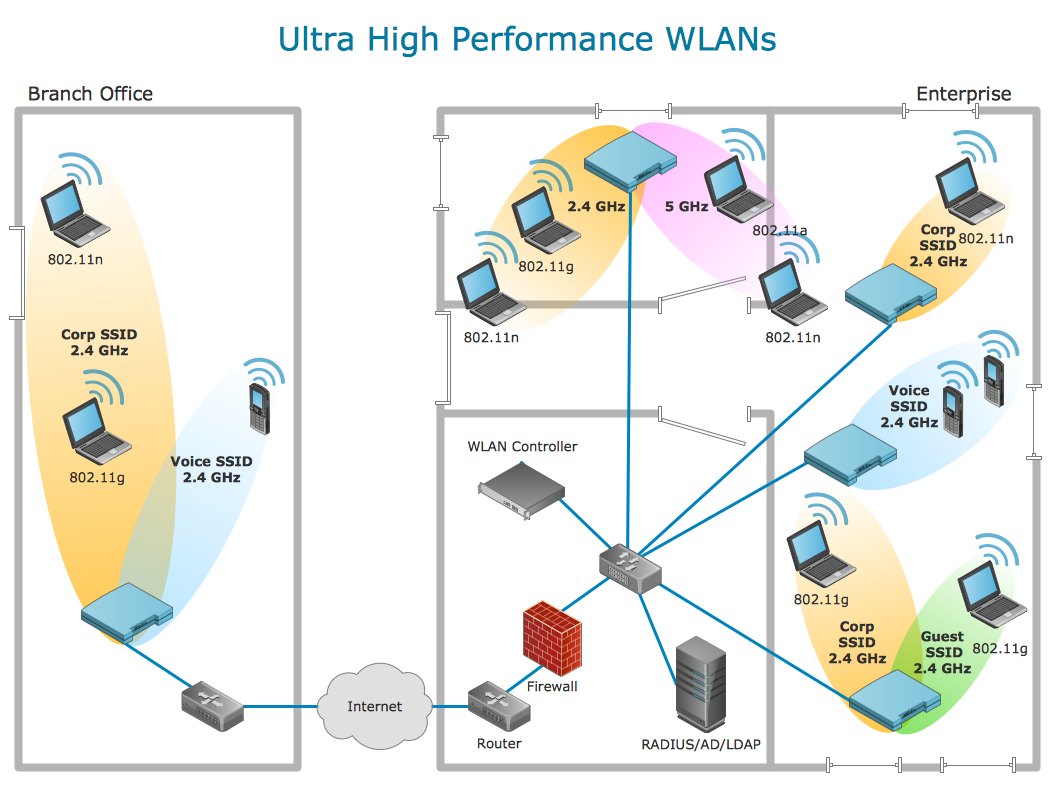
Network diagram - Ultra high performance WLAN- Draw Fishbone Diagram on MAC Software | Fishbone Software ...
- Fishbone Diagrams | Draw Fishbone Diagram on MAC Software ...
- Draw Fishbone Diagram on MAC Software | Fishbone Diagram ...
- Fishbone Diagram Example | Draw Fishbone Diagram on MAC ...
- Fishbone Diagram Template | Draw Fishbone Diagram on MAC ...
- Draw Fishbone Diagram on MAC Software | 25 Typical Orgcharts ...
- Draw Fishbone Diagram on MAC Software | PROBLEM ANALYSIS ...
- Fishbone Diagrams | Fishbone Diagram In Software Requirements ...
- Draw Fishbone Diagram on MAC Software | Fishbone Diagram ...
- Fishbone Diagrams | Fishbone Diagram | Mac Diagramming ...
- Fishbone diagram - Causes of low-quality output | Fishbone ...
- Fishbone Diagrams | Total Quality Management with ConceptDraw ...
- Cause and Effect Fishbone Diagram | Cause and Effect Analysis ...
- How to Create a Fishbone ( Ishikawa ) Diagram Quickly | How To ...
- Fishbone Diagram | Fishbone Diagrams | Mind Map Free Download ...
- Fishbone Diagram Example | How Do Fishbone Diagrams Solve ...
- How to Add a Fishbone ( Ishikawa ) Diagram to an MS Word Document
- Flowchart Software | Fishbone Diagram Template | Business ...
- Draw Fishbone Diagram on MAC Software | How to Draw a Process ...
- Fishbone Diagrams | Fishbone Diagram Problem Solving | Using ...
- ERD | Entity Relationship Diagrams, ERD Software for Mac and Win
- Flowchart | Basic Flowchart Symbols and Meaning
- Flowchart | Flowchart Design - Symbols, Shapes, Stencils and Icons
- Flowchart | Flow Chart Symbols
- Electrical | Electrical Drawing - Wiring and Circuits Schematics
- Flowchart | Common Flowchart Symbols
- Flowchart | Common Flowchart Symbols


.png)


