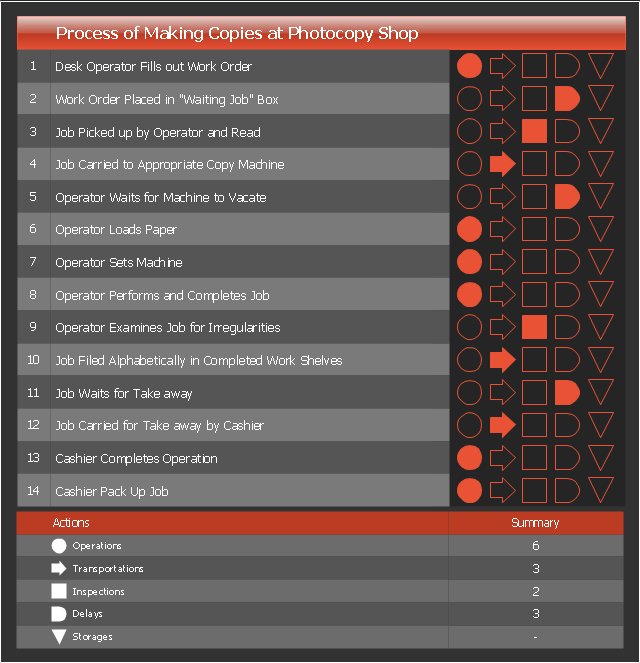
Flow process chart is used in quality control to display the action sequence of physical or manual process.
Flow process chart is useful for recording actions and documenting the production process.
Flow process chart helps to analyze and improve the process steps.
Flow process chart is more preferable than flowchart for documenting the mostly sequential processes.
Three types of flow process charts include: 1) man-type charts depicting the person actions, 2) material-type charts displaying the actions with product or material object, 3) equipment-type charts visualizing the useage of tools and equipment.
The set of symbols used in the flow process charts was developed by the American Society of Mechanical Engineers (ASME).
This flow process chart example was created using the ConceptDraw PRO diagramming and vector drawing software extended with the Matrices solution from the Marketing area of ConceptDraw Solution Park.
Flow process chart
Types of Flowcharts


Block Diagram

Use the libraries from the Block Diagrams solution to draw block diagrams for your business documents, presentations and websites in a few minutes.
Value Stream Mapping Symbols

Flowchart Software

The Flowcharts diagrams are widely used for designing, documenting, analyzing and managing the complex processes and programs in various fields such as business, engineering, architecture, science, manufacturing, administration, etc.
Value stream with ConceptDraw DIAGRAM

Flowchart Maker

Business graphic applications show a special knowledge representations and include many features for creating schematic pictures. These graphic tools are known as flowchart maker or flowchart maker software.
ConceptDraw Arrows10 Technology

Entity Relationship Diagram Symbols

ERD symbols used for professional ERD drawing are collected in libraries from the Entity-Relationship Diagram (ERD) solution for ConceptDraw DIAGRAM.
Definition TQM Diagram

Process Flow Chart Symbols

It is incredibly convenient to use the ConceptDraw DIAGRAM software extended with Flowcharts Solution from the "Diagrams" Area of ConceptDraw Solution Park for designing professional looking Process Flow Charts.
Electrical Symbols, Electrical Diagram Symbols

This solution provides 26 libraries which contain 926 electrical symbols from electrical engineering: Analog and Digital Logic, Composite Assemblies, Delay Elements, Electrical Circuits, Electron Tubes, IGFET, Inductors, Integrated Circuit, Lamps, Acoustics, Readouts, Logic Gate Diagram, MOSFET, Maintenance, Power Sources, Qualifying, Resistors, Rotating Equipment, Semiconductor Diodes, Semiconductors, Stations, Switches and Relays, Terminals and Connectors, Thermo, Transformers and Windings, Transistors, Transmission Paths,VHF UHF SHF.
Campus Area Networks (CAN). Computer and Network Examples
. <br>Computer and Network Examples *")
The elementary campus networks arise spontaneously: the radio signals from the access points, which provide network inside the building are not limited to its walls, so any user in the backyard can also get wireless network access. The larger and more complex campus network may have additional access points in places specially chosen for serving clients, i.e., on the lawn in front of the college or in a coffee shop around the corner.

How to Draw Pictorial Chart. How to Use Infograms

Pictorial Infographics solution contains large number of libraries with variety of predesigned vector pictograms that allows you design infographics in minutes. There are available 10 libraries with 197 vector pictograms.
Bar Diagrams for Problem Solving. Create space science bar charts with Bar Graphs Solution

Create bar graphs for visual solving your scientific problems and data comparison using the ConceptDraw DIAGRAM diagramming and vector drawing software extended with the Bar Graphs Solution from the Graphs and Charts area of ConceptDraw Solition Park.
Local area network (LAN). Computer and Network Examples
 diagram")
ConceptDraw - Perfect Network Diagramming Software with examples of LAN Diagrams. ConceptDraw Network Diagram is ideal for network engineers and network designers who need to draw Local Area Network diagrams.
IDEF9 Standard

Matrix Organization

Business and Finance Illustrations

The Business and Finance solution contains 12 vector clipart libraries: Advertising, Business, Business people clipart, Business people figures, Currency, Mail and post, Management, Marketing, Money, Office, Project management, Time
Sign Making Software

Sign making software is very useful tool for professional sign-making business. Use ConceptDraw DIAGRAM and make sure that now sign making is easier and timesaving than ever!
- Flow process chart | Types of Flowcharts | Block Diagram ...
- What Is Man Type Flow Process Chart
- Process Flowchart | Flow chart Example. Warehouse Flowchart ...
- Flow process chart | Business Process Modeling Notation Template ...
- LLNL Flow Charts | A Flow Process Charts About Material Type With ...
- Material Type Flow Type Process Chart
- Example Of Man Type Flow Process Chart
- Flow Process Chart Man Machine And Material Type
- Flow process chart | Process Flow Chart | Material Requisition ...
- Flow process chart | Business Process Flowchart Symbols | Material ...
- Example Of Man Type Chart In University Area
- Flow process chart | LLNL Flow Charts | Order processing - EPC ...
- Network Diagrams for Bandwidth Management | Man Type Flow ...
- Bubble diagrams in Landscape Design with ConceptDraw DIAGRAM
- Flow process chart | UML Diagram Types List | Basic Flowchart ...
- ConceptDraw DIAGRAM Compatibility with MS Visio | Event-driven ...
- LLNL Flow Charts | Type Of Flow Chart With Explanation
- | What Are The Type Of Flow Chat
- LLNL Flow Charts | Different Forms Of Flow Charts
- | Type Of Flow Chat
- ERD | Entity Relationship Diagrams, ERD Software for Mac and Win
- Flowchart | Basic Flowchart Symbols and Meaning
- Flowchart | Flowchart Design - Symbols, Shapes, Stencils and Icons
- Flowchart | Flow Chart Symbols
- Electrical | Electrical Drawing - Wiring and Circuits Schematics
- Flowchart | Common Flowchart Symbols
- Flowchart | Common Flowchart Symbols