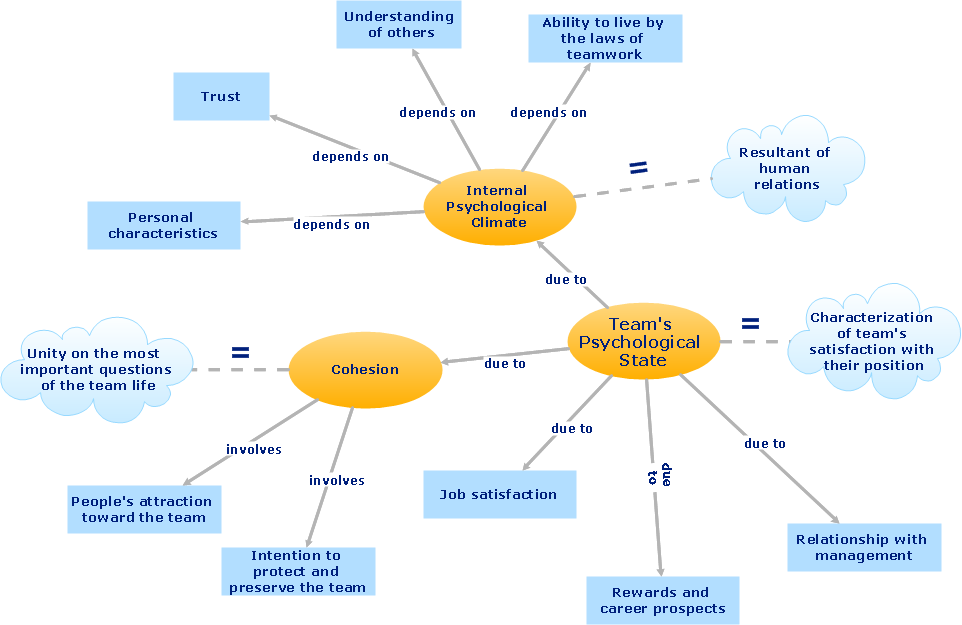
Sample 1. Concept map - Team psychological characteristics.
ConceptDraw DIAGRAM diagramming software provides vector shapes and connector tools for quick and easy drawing diagrams for business, technology, science and education.
Use ConceptDraw DIAGRAM enhanced with solutions from ConceptDraw Solution Park to create diagrams to present and explain structures, process flows, logical relationships, networks, and other visually organized information and knowledge.
TEN RELATED HOW TO's:
While creating flowcharts and process flow diagrams, you should use special objects to define different statements, so anyone aware of flowcharts can get your scheme right. There is a short and an extended list of basic flowchart symbols and their meaning. Basic flowchart symbols include terminator objects, rectangles for describing steps of a process, diamonds representing appearing conditions and questions and parallelograms to show incoming data.
This diagram gives a general review of the standard symbols that are used when creating flowcharts and process flow diagrams. The practice of using a set of standard flowchart symbols was admitted in order to make flowcharts and other process flow diagrams created by any person properly understandable by other people. The flowchart symbols depict different kinds of actions and phases in a process. The sequence of the actions, and the relationships between them are shown by special lines and arrows. There are a large number of flowchart symbols. Which of them can be used in the particular diagram depends on its type. For instance, some symbols used in data flow diagrams usually are not used in the process flowcharts. Business process system use exactly these flowchart symbols.
Picture: Flowchart Symbols: Meaning and Examples
Related Solution:
ConceptDraw gives the ability to draw simple diagrams like flowcharts, block diagrams, bar charts, histograms, pie charts, divided bar diagrams, line graphs, area charts, scatter plots, circular arrows diagrams, Venn diagrams, bubble diagrams, concept maps, and others.
Picture: Simple Drawing Applications for Mac
Related Solution:
The available pre-made examples of the matrices, including the Porter's Value Chain’s one can be found in the mentioned solution. It also allows creating an Ansoff matrix, a BCG matrix, a Competitive strategies matrix, a Four-quadrant matrix, a Chore chart, a Flow process chart, a Quality function deployment matrix, a Positioning map and Porter’s generic strategies matrix being based on the templates given within the Matrices solution.
Picture: Porter's Value Chain
Related Solution:
All computer networks differ by various params, and their size is one of them. As global area networks are the biggest, personal area (PAN) networks are the smallest. Personal computers, smartphones and other devices that have possibility to connect to Internet form a personal network.
This diagram was created using ConceptDraw Computer Network Diagrams to represent a typical components of Personal area network. A personal area network (PAN) is the connection of IT devices around an individual person. This sample of personal area network involves a notebook, a personal digital assistant (PDA), and a portable printer. Commonly a PAN contains such wireless devices as mouse, keyboard, smartphone and tablet. A wireless connection is typical for a PAN.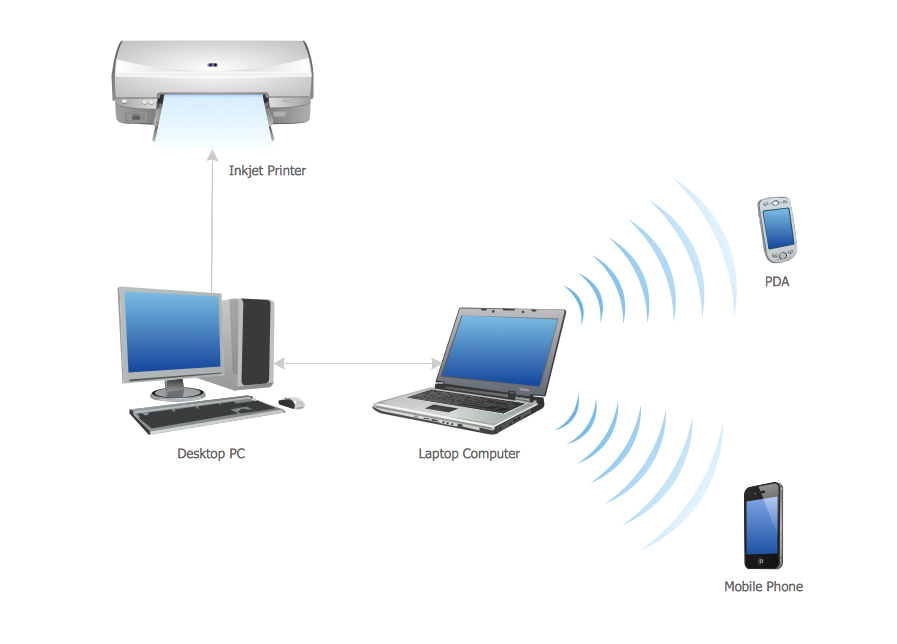
Picture: Personal area (PAN) networks. Computer and Network Examples
Related Solution:
ConceptDraw MINDMAP a versatile, yet easy-to-use tool for organizing ideas and data. Creates mind maps that intuitively illustrate your thought process. Outputs a wide variety of document styles and formats. Delivers presentations from mind maps with built-in modes and MS PowerPoint export. Perfect for brainstorming, project planning, meeting management, note taking, and more.
Picture: Creating a default presentation in ConceptDraw MINDMAP
But how to design a Flow Chart fast and easy? We recommend to use a ConceptDraw DIAGRAM software with Flowcharts Solution.
Picture: Flow Chart
Related Solution:
Competitor analysis is a first and obligatory step in elaboration the proper corporate marketing strategy and creating sustainable competitive advantage. Use powerful opportunities of numerous solutions from ConceptDraw Solution Park for designing illustrative diagrams, charts, matrices which are necessary for effective competitor analysis.
Picture: Competitor Analysis
Related Solution:
This mind map shows 8 steps approach to solving any kind of product or service problems.
Picture: 8 Step Problem Solving
Related Solution:
ConceptDraw DIAGRAM is a flowchart creating software. This software includes over 20 vector stencils in libraries. These objects allow you to create well-designed flowcharts.
Put an initial object from library to a page and use RapidDraw technology clicking on direction arrows to add new objects to the flowchart. This way you can make flowchart quickly.
Picture: How To Create a Flow Chart in ConceptDraw
Related Solution:
This sample shows the Flowchart of the testing the work of the lamp and decision making about what to do to lamp will work.
Picture: Samples of Flowchart
Related Solution: