How to Draw an Organization Chart
Running your own businesses? Managing people working in the company? Working as HR specialist? Then you definitely need the right software to work in, creating the charts, diagrams in terms of succeeding in your sphere. We know such software called ConceptDraw DIAGRAM which allows you in short terms to make organizational charts in order to share responsibilities and delegate authority. If you wonder what to start with and how to draw it, you can watch video on our site describing this process in details. Also you can download our application ConceptDraw STORE where lots of libraries with objects, vector elements and symbols are waiting for you to use them for your flowcharts as well as schemes, diagrams, charts and plans. To make sure you can do it in short terms, we provide you with examples and templates of pre-designed already existing charts to use them as the drafts for you so it can be always corrected and edited the way you want. The innovative ConceptDraw Arrows 10 Technology is the powerful drawing tool that can be used for making any kind of existing diagrams. Once you try, you’ll realize how simple and clever it is, so you will recommend ConceprDraw DIAGRAM to those who you do care about and so they will succeed as well.Examples of Flowcharts, Organizational Charts , Network Diagrams
Drawing your own flowcharts, diagrams and plans it is better to use the existing layouts to be able to make them correctly with help of tutorials. Using examples from our site you can simplify your work making it possible to create business or network diagrams and any needed spectacular flowcharts with an easiness having all of them looking professional and mature. Try the Business Diagram, Floor Plan, Business Charts examples, Graphic Organizer ones, Scientific Illustration, Engineering Diagram ones, Illustration examples as well as very many more from our Solution Park and find it simple to create something special in short terms with almost no effort at all! Geo Map and Mind Map Examples, UML and Circular Diagram ones, Project Management Examples, Network and Business Diagram ones as well as lots and lots of charts, flowcharts, plans and diagrams are there to your service. ConceptDraw DIAGRAM is here for your use!
 Organizational Charts Solution. ConceptDraw.com
An organizational chart can be also called as an “organization chart ”, an “org
chart ” or as an “organogram”. Being a diagram that shows the structure of an
How to Report Task's Execution with Gantt Chart
ConceptDraw Project Gantt chart reports galleryHow To Create a Flow Chart in ConceptDraw. Free Trial for Mac
Flow chart - HR management processHelpDesk
Creating a Pie chart. ConceptDraw HelpDesk
A pie chart represents data, in a clear and easy to read around (pie) form. A circular pie chart is divided into sections (slice). Each.
 Pie Charts Solution. ConceptDraw.com
The Pie Chart is one of the most popular statistical charts , widely used to
visualize all kinds of data, in cases when you need to show the ratio of the part
and
HelpDesk
Drawing a Pictorial Charts. ConceptDraw HelpDesk
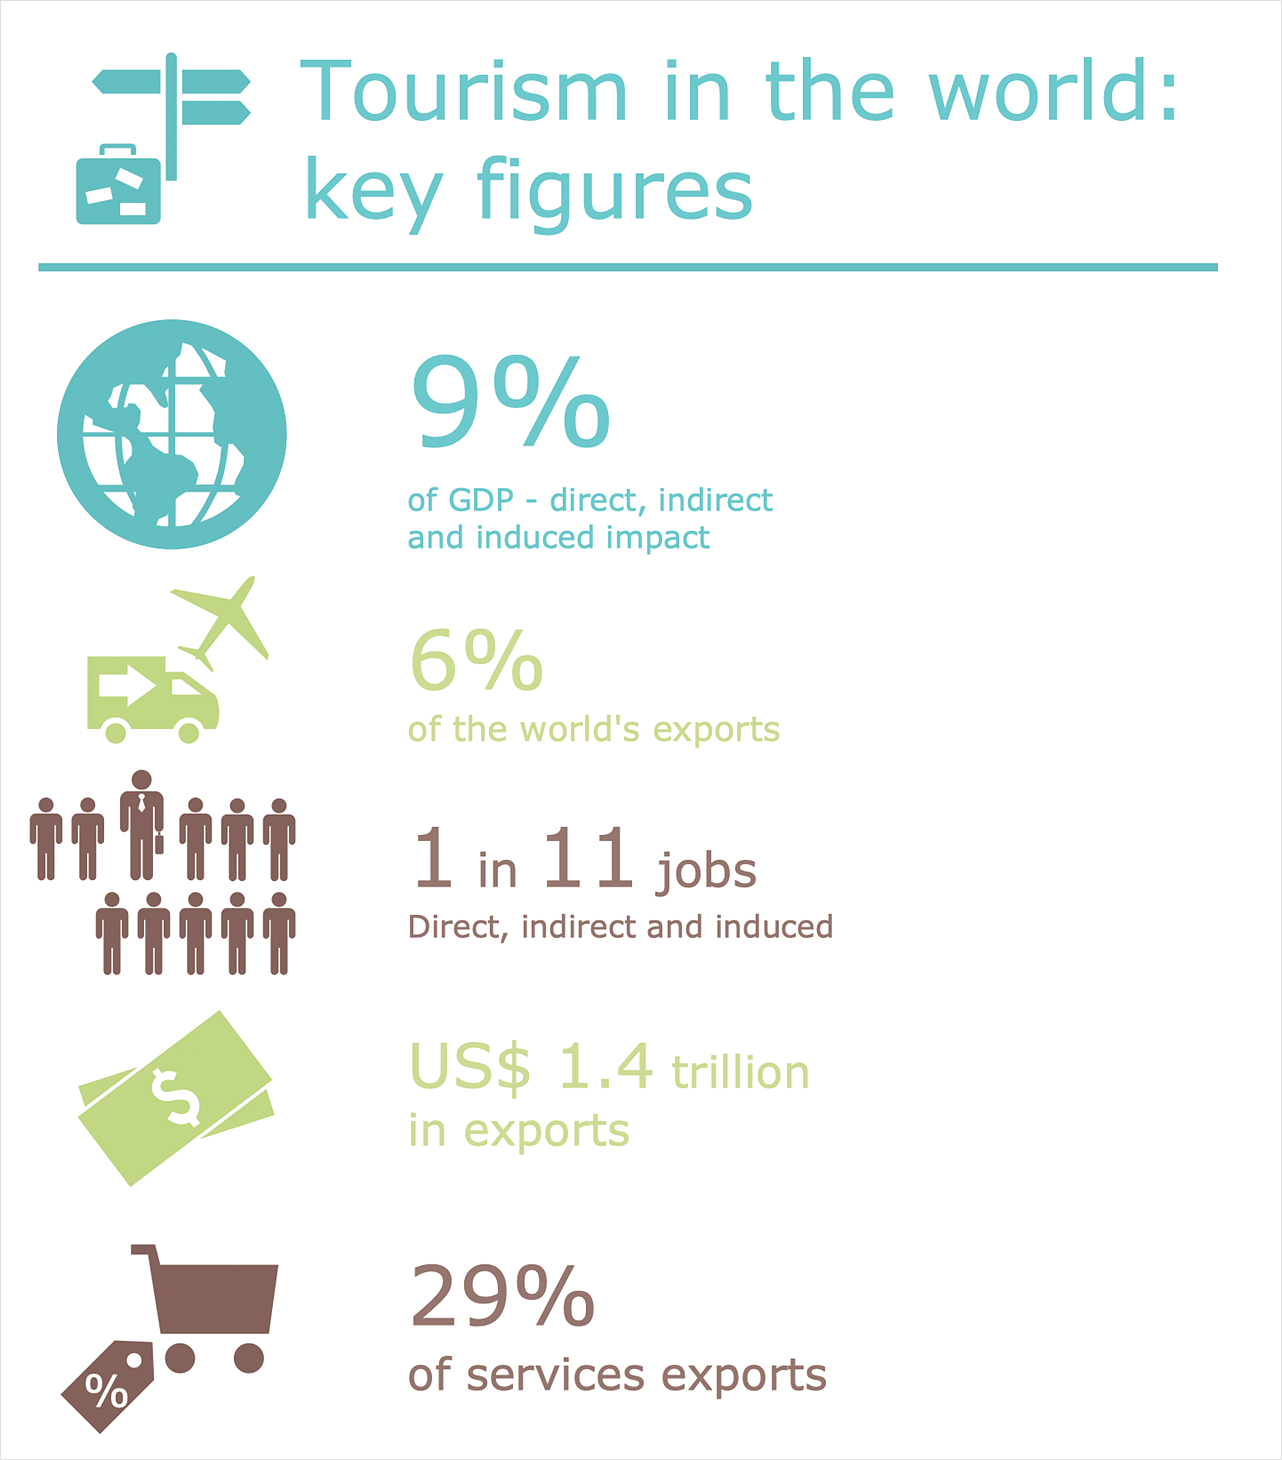
A Pictorial chart is a type of Pictorial Infographics. It is used to visually present data comparison. Pictorial charts use relative sizes or repetitions of the same icon ,HelpDesk
How to Create a Release Burn-down Chart |ConceptDraw HelpDesk
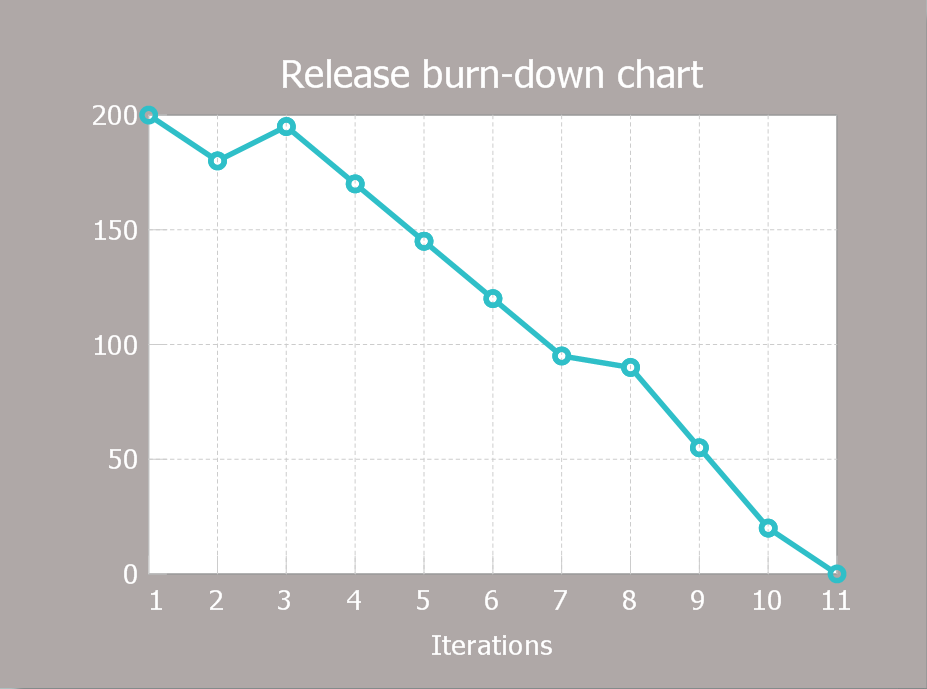
A Release burn-down chart is used to track progress on a Scrum project. It should be updated at the end of each iteration. The horizontal axis of the release- Atmosphere air composition | Percentage Pie Chart . Pie Chart ...
- Schedule pie chart - Daily action plan | Chart Maker for ...
- Percentage Pie Chart . Pie Chart Examples | Atmosphere air ...
- What is Gantt Chart (historical reference) | Gantt charts for planning ...
- What Is Man Type Flow Process Chart
- Process Flowchart | Flow chart Example. Warehouse Flowchart ...
- Difference Between Flowchart And Bar Chart
- Business Report Pie. Pie Chart Examples | Example of ...
- Flow chart Example. Warehouse Flowchart | DFD - Process of ...
- Process Flowchart | Logistics Flow Charts | Types of Flowcharts ...
- How to Draw the Different Types of Pie Charts | Visio Charting ...
- Company's organizational chart | ConceptDraw MINDMAP ...
- Flow Chart Of Telecommunication
- Logistics Flow Charts | Process Flowchart | How to Make a Logistics ...
- Multiple Decision Point Flow Chart
- Flowchart Definition | Types of Flowcharts | Matrix Organization ...
- Flow Chart Purchase To Sales
- Sales Process Flowchart Symbols | Flowchart design. Flowchart ...
- Flow Chart In Operation Research
- How to Draw an Organization Chart | Marketing and Sales ...


