 Divided Bar Diagrams Solution. ConceptDraw.com
The Divided Bar Diagrams Solution extends the capabilities of ConceptDraw
PRO v10 with templates, samples, and a library of vector stencils for drawing high

HelpDesk
Draw Divided Bar Chart . ConceptDraw HelpDesk
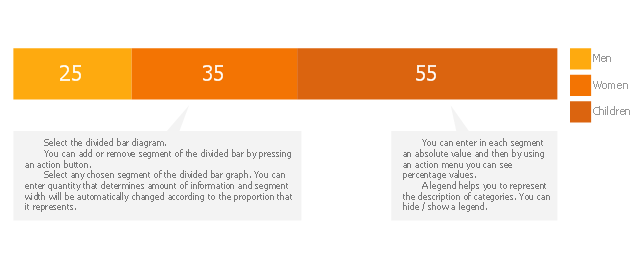
A divided bar graph is a rectangle divided into smaller rectangles along its length in proportion to the data. Segments in a divided bar represent a set of
 Basic Divided Bar Diagrams Solution. ConceptDraw.com
This solution extends the capabilities of ConceptDraw PRO v10.3.0 (or later) with
templates, samples and a library of vector stencils for drawing Divided Bar
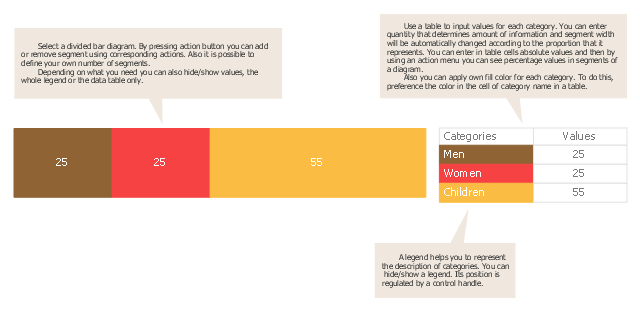
Use this chart template to design your divided bar diagrams . A divided bar chart
is a rectangle divided into segments, illustrating numerical proportion.

-divided-bar-diagrams---vector-stencils-library.png--diagram-flowchart-example.png)
The vector stencils library " Divided bar diagrams " contains 12 templates of
divided bar diagrams for visualizing percent composition of one total consists of
few
This divided bar graph displays the number of people per day who visited
swimming pool. Use this template to design your divided bar charts . The chart

Bar Diagrams for Problem Solving - business management bar charts

Bar Diagrams for Problem Solving. Business Management
Bar Diagrams for Problem Solving - business management bar charts

This divided bar chart sample shows the petroleum products yielded from 1
barrel of crude oil in California in 2004. It was drawn using data from the chart on
the

 Bar Graphs Solution. ConceptDraw.com
The Bar Graphs solution enhances ConceptDraw PRO v10 functionality with of
Bar Graphs , such as Simple Bar Graph , Double Bar Graph , Divided Bar Graph ,
Vertical bar chart example - Change in Productivity within the Manufacturing Sector of industry in the United States, 1987 - 2010

Bar Diagrams for Problem Solving. Manufacturing and Economics
Vertical bar chart example - Change in Productivity within the Manufacturing Sector of industry in the United States, 1987 - 2010Relative Value Chart Software

Relative Value Chart Software
Relative Value Chart Software- How to Draw a Divided Bar Chart in ConceptDraw PRO | Divided ...
- Divided Bar Graph Template
- Divided Bar Diagrams | How to Draw a Divided Bar Chart in ...
- Diagram Illustrating Divided Bar Chart
- Bar Diagram Math | Divided Bar Diagrams | Bar Graphs | 3 Bar ...
- Divided bar diagram - Template
- Divided Bar Diagrams | Bar Graphs | Bar Chart Template for Word ...
- Diagramatic Of Divided Bar Graph
- Bar Diagram Math | Divided Bar Diagrams | Double bar graph ...
- Divided Bar Diagrams | Bar Diagrams for Problem Solving. Create ...
- Divided bar diagrams - Vector stencils library
- Divided bar diagrams - Vector stencils library | Bar Diagram Math ...
- How to Draw a Divided Bar Chart in ConceptDraw PRO | Subdivided ...
- Bar Diagram Math | Divided bar diagram - Template | London ...
- Bar Diagram Math | Divided Bar Diagrams | Bar Graph | Bar Graph ...
- London election results - Divided bar diagram | Bar Diagram Math ...
- Pie Graph Worksheets | How to Draw a Divided Bar Chart in ...
- Sales Growth. Bar Graphs Example | Divided Bar Diagrams ...
- How to Draw a Divided Bar Chart in ConceptDraw PRO | Bar Chart ...
- Geo Map - Asia - Philippines | Bar Diagram Math | Divided Bar ...