Bar Diagram Math

 Divided Bar Diagrams
The Divided Bar Diagrams Solution extends the capabilities of ConceptDraw PRO v10 with templates, samples, and a library of vector stencils for drawing high impact and professional Divided Bar Diagrams and Graphs, Bar Diagram Math, and Stacked Graph.
 Bar Graphs
The Bar Graphs solution enhances ConceptDraw PRO v10 functionality with templates, numerous professional-looking samples, and a library of vector stencils for drawing different types of Bar Graphs, such as Simple Bar Graph, Double Bar Graph, Divided Bar Graph, Horizontal Bar Graph, Vertical Bar Graph, and Column Bar Chart.
Bar Diagrams for Problem Solving. Create business management bar charts with Bar Graphs Solution

Venn Diagram Examples for Problem Solving. Venn Diagram as a Truth Table

Bar Diagrams for Problem Solving. Create space science bar charts with Bar Graphs Solution

Bar Chart

Bar Charts

Mathematical Diagrams

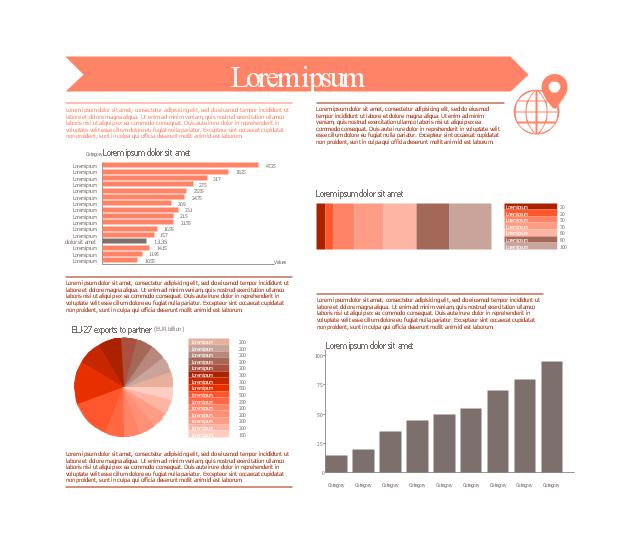
This marketing infographic template consists of design elements: title block, callout blocks, pictogram, horizontal bar graph, column chart, divided bar diagram, pie chart.
Use it to create your marketing infograms in the ConceptDraw PRO diagramming and vector drawing software.
The template "Marketing infogram 3" is included in the Marketing Infographics solution from the Business Infographics area of ConceptDraw Solution Park.
Use it to create your marketing infograms in the ConceptDraw PRO diagramming and vector drawing software.
The template "Marketing infogram 3" is included in the Marketing Infographics solution from the Business Infographics area of ConceptDraw Solution Park.
Marketing infogram template
 Basic Diagramming
This solution extends ConceptDraw PRO software with the specific tools you need to easily draw flowcharts, block diagrams, histograms, pie charts, divided bar diagrams, line graphs, circular arrows diagrams, Venn diagrams, bubble diagrams and concept maps
Interactive Venn Diagram

Venn Diagram Examples for Problem Solving. Environmental Social Science. Human Sustainability Confluence

Bar Chart Software

Venn Diagram Examples for Problem Solving . Quantum Information Science. BQP Complexity

- Time series charts - Vector stencils library | Bar Diagrams for ...
- Bar Diagram Math | Basic Diagramming | Mathematics Symbols ...
- Bar Diagram Math | Mathematical Diagrams | Basic Diagramming ...
- Bar Diagrams for Problem Solving. Create business management ...
- Bar Diagrams for Problem Solving. Create space science bar charts ...
- Basic Diagramming | Bar Diagram Math | Mathematical Diagrams ...
- Bar Diagram Math | Math illustrations - Template | Basic ...
- Basic Flowchart Symbols and Meaning | Basic Diagramming | Bar ...
- Divided Bar Diagrams
- Bar Diagrams for Problem Solving. Create business management
- Bar Diagrams for Problem Solving. Create economics and financial ...
- Basic Diagramming | Mathematics Symbols | Bar Diagram Math ...
- Cause and Effect Diagram | Bar Diagrams for Problem Solving ...
- Basic Diagramming | Mathematical Diagrams | Bar Diagram Math ...
- Mathematical Diagrams | Bar Diagram Math | Mathematics | Math ...
- Basic Diagramming | Mathematics | Bar Diagram Math | Math Mind ...
- 3 Circle Venn. Venn Diagram Example
- Types of Flowchart - Overview | Bar Diagram Math | Total Quality ...
- Mathematics Symbols | Bar Diagram Math | Scientific Symbols Chart ...
- Venn Diagram Examples for Problem Solving. Venn Diagram as a ...