HelpDesk
How to Draw a Divided Bar Chart

 Basic Divided Bar Diagrams
This solution extends the capabilities of ConceptDraw DIAGRAM with templates, samples and a library of vector stencils for drawing Divided Bar diagrams.
 Divided Bar Diagrams
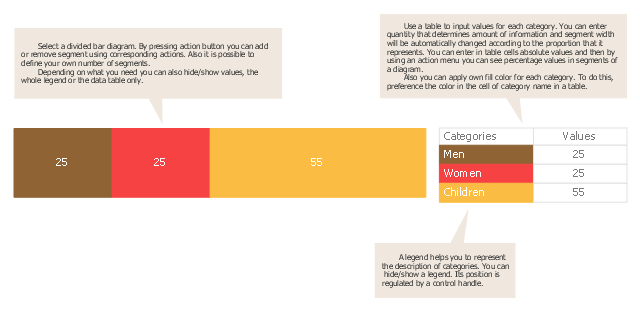
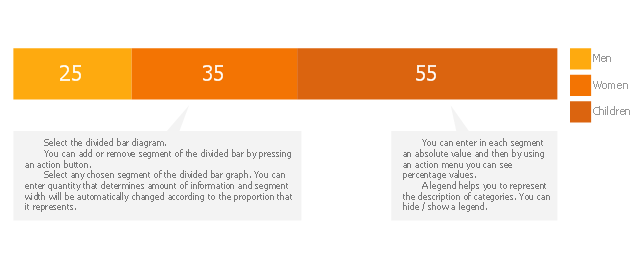
Divided Bar Diagrams Solution extends the capabilities of ConceptDraw DIAGRAM with templates, samples, and a library of vector stencils for drawing high impact and professional Divided Bar Diagrams and Graphs, Bar Diagram Math, and Stacked Graph. Divided Bar Diagram library objects include a legend that describes categories and can be shown or hidden, moved into a diagram; some objects also include a table of input values for categories. Enter your data in the table, and the segments will be displayed on the chart in accordance with the table data; when you make changes, the chart changes automatically.
Use this chart template to design your divided bar diagrams.
A divided bar chart is a rectangle divided into segments, illustrating numerical proportion. In a divided bar chart, the length of each segment (and consequently its area), is proportional to the quantity it represents.
This divided bar graph displays the number of people per day who visited swimming pool.
The template "Divided bar diagram" for the ConceptDraw PRO diagramming and vector drawing software is included in the Divided Bar Diagrams solution from the Graphs and Charts area of ConceptDraw Solution Park.
Template
This divided bar graph displays the number of people per day who visited swimming pool. Use this template to design your divided bar charts.
The chart template "Divided bar diagram" for the ConceptDraw PRO diagramming and vector drawing software is included in the Basic Divided Bar Diagrams solution from the Graphs and Charts area of ConceptDraw Solution Park.
The chart template "Divided bar diagram" for the ConceptDraw PRO diagramming and vector drawing software is included in the Basic Divided Bar Diagrams solution from the Graphs and Charts area of ConceptDraw Solution Park.
Chart template
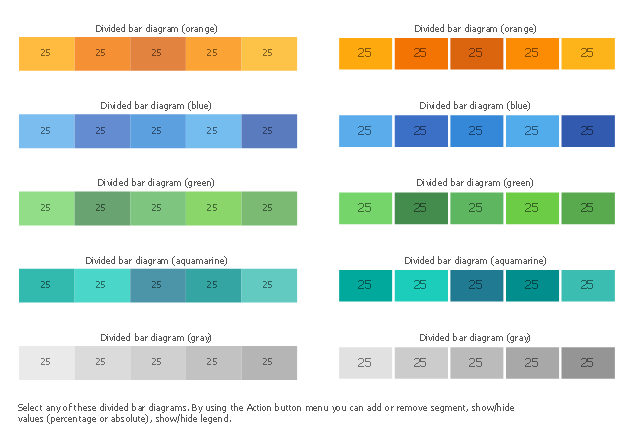
The vector stencils library "Divided bar diagrams" contains 10 chart templates. Use it to draw your divided bar charts in the ConceptDraw PRO diagramming and vector drawing software.
A divided bar graph is a horizontal bar divided into segments to illustrate numerical proportion. Each segment length represents the percentage of the part in the 100% total amount.
The chart templates example "Design elements - Divided bar diagrams"
is included in the Basic Divided Bar Diagrams solution from the Graphs and Charts area of ConceptDraw Solution Park.
Chart templates
The vector stencils library "Composition charts" contains 6 templates: 2 pie charts, 2 divided bar charts and 2 double divided bar charts.
The vector stencils library "Composition indicators" contains 6 templates of visual indicators.
Use these design elements to visualize composition comparison of your data in your visual dashboard created using the ConceptDraw PRO diagramming and vector drawing software.
"A pie chart (or a circle graph) is a circular chart divided into sectors, illustrating numerical proportion. In a pie chart, the arc length of each sector (and consequently its central angle and area), is proportional to the quantity it represents. While it is named for its resemblance to a pie which has been sliced, there are variations on the way it can be presented. ...
An obvious flaw exhibited by pie charts is that they cannot show more than a few values without separating the visual encoding (the “slices”) from the data they represent (typically percentages). When slices become too small, pie charts have to rely on colors, textures or arrows so the reader can understand them. This makes them unsuitable for use with larger amounts of data. Pie charts also take up a larger amount of space on the page compared to the more flexible alternative of bar charts, which do not need to have separate legends, and can also display other values such as averages or targets at the same time. ...
Most subjects have difficulty ordering the slices in the pie chart by size; when the bar chart is used the comparison is much easier. Similarly, comparisons between data sets are easier using the bar chart. However, if the goal is to compare a given category (a slice of the pie) with the total (the whole pie) in a single chart and the multiple is close to 25 or 50 percent, then a pie chart can often be more effective than a bar graph." [Pie chart. Wikipedia]
The example "Design elements - Composition charts and indicators" is included in the Composition Dashboard solution from the area "What is a Dashboard" of ConceptDraw Solution Park.
Composition charts and visual indicators

Bar Chart

The vector stencils library "Data-driven charts" contains 13 data-driven graphs and charts: area chart, divided bar diagram, double bar graph, frequency histogram, horizontal bar chart, line graph, percentage ring chart, percentage pie chart, scatter plot, column chart, waterfall chart.
Use it to visualize quantitative data in your data-driven infographics.
The graphs example "Data-driven charts - Vector stencils library" was created using the ConceptDraw PRO diagramming and vector graphics software extended with the Data-driven Infographics solution from the area "What is infographics" of ConceptDraw Solution Park.
Area chart

Divided bar diagram

Double bar graph

Frequency histogram

Horizontal bar graph

Line graph

Percentage ring chart

Pie chart

Percentage pie chart

Ring chart

Scatter plot

Column chart (vertical bar graph)
-data-driven-charts---vector-stencils-library.png--diagram-flowchart-example.png)
Waterfall chart

This divided bar chart sample shows the petroleum products yielded from 1 barrel of crude oil in California in 2004. It was drawn using data from the chart on the California Energy Almanac website. [energyalmanac.ca.gov/ gasoline/ whats_ in_ barrel_ oil.html]
"Petroleum products are useful materials derived from crude oil (petroleum) as it is processed in oil refineries. Unlike petrochemicals, which are a collection of well-defined usually pure chemical compounds, petroleum products are complex mixtures. The majority of petroleum is converted to petroleum products, which includes several classes of fuels.
According to the composition of the crude oil and depending on the demands of the market, refineries can produce different shares of petroleum products. The largest share of oil products is used as "energy carriers", i.e. various grades of fuel oil and gasoline. These fuels include or can be blended to give gasoline, jet fuel, diesel fuel, heating oil, and heavier fuel oils. Heavier (less volatile) fractions can also be used to produce asphalt, tar, paraffin wax, lubricating and other heavy oils. Refineries also produce other chemicals, some of which are used in chemical processes to produce plastics and other useful materials. Since petroleum often contains a few percent sulfur-containing molecules, elemental sulfur is also often produced as a petroleum product. Carbon, in the form of petroleum coke, and hydrogen may also be produced as petroleum products. The hydrogen produced is often used as an intermediate product for other oil refinery processes such as hydrocracking and hydrodesulfurization." [Petroleum product. Wikipedia]
The chart example "Petroleum products yielded from one barrel of crude oil" was created using the ConceptDraw PRO diagramming and vector drawing software extended with the Divided Bar Diagrams solution from the Graphs and Charts area of ConceptDraw Solution Park.
Divided bar chart

Stacked Graph

The vector stencils library "Education charts" contains 12 graphs and charts: area chart, column chart, divided bar diagram, histogram, horizontal bar graph, line graph, pie chart, ring chart, scatter plot.
Use it to create your education infogram in the ConceptDraw PRO diagramming and vector drawing software.
The vector stencils library "Education charts" is included in the Education Infographics solution from the Business Infographics area of ConceptDraw Solution Park.
Use it to create your education infogram in the ConceptDraw PRO diagramming and vector drawing software.
The vector stencils library "Education charts" is included in the Education Infographics solution from the Business Infographics area of ConceptDraw Solution Park.
Area chart - serial

Column chart

Column chart - serial

Divided bar diagram

Frequency histogram

Horizontal bar chart

Horizontal bar chart - serial

Line chart - serial

Pie chart

Ring chart

Scatter plot

Scatter plot - serial

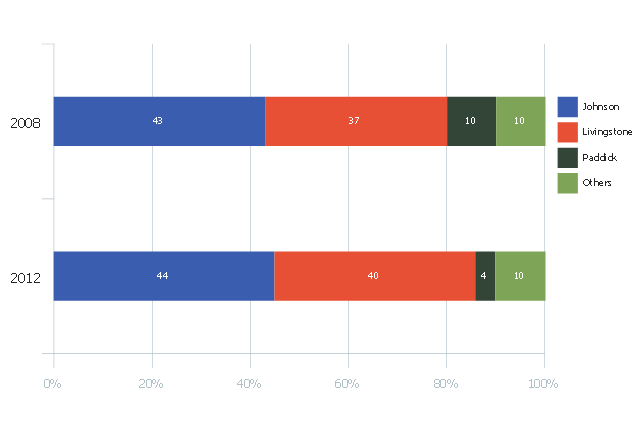
This divided bar diagram sample shows London election results in 2008 and 2012. It was drawn using data from the infographics "London Elections Results by Numbers" on the london.gov.uk website.
[data.london.gov.uk/ datastore/ package/ london-elections-results-2012-wards-boroughs-constituency]
"There are six types of elections in the United Kingdom: United Kingdom general elections, elections to devolved parliaments and assemblies, elections to the European Parliament, local elections, mayoral elections and Police and Crime Commissioner elections. Elections are held on Election Day, which is conventionally a Thursday. General elections do not have fixed dates, but must be called within five years of the opening of parliament following the last election. Other elections are held on fixed dates, though in the case of the devolved assemblies and parliaments early elections can occur in certain situations. Currently, six electoral systems are used: the single member plurality system (First Past the Post), the multi member plurality system, party list PR, the single transferable vote, the Additional Member System and the Supplementary Vote.
Elections are administered locally: in each lower-tier local authority, the actual polling procedure is run by the Returning Officer and the compiling and maintenance of the electoral roll by the Electoral Registration Officer (except in Northern Ireland, where the Electoral Office for Northern Ireland assumes both responsibilities). The Electoral Commission only sets standards for and issues guidelines to Returning Officers and Electoral Registration Officers, but is responsible for nationwide electoral administration (such as the registration of political parties and directing the administration of national referendums)." [Elections in the United Kingdom. Wikipedia]
The chart example "London election results" was created using the ConceptDraw PRO diagramming and vector drawing software extended with the Divided Bar Diagrams solution from the Graphs and Charts area of ConceptDraw Solution Park.
Divided bar chart
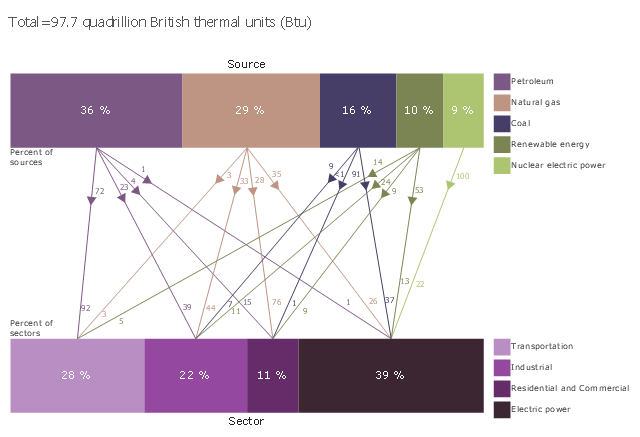
This divided bar diagram sample shows U.S. primary energy consumption by source and sector in 2015. It was designed using data from the chart in the webpage "U.S. Energy Facts Explained, Consumption & Production" on the website of the U.S. Energy Information Administration.
"Americans use many types of energy
Petroleum, natural gas, coal, renewable energy, and nuclear electric power are primary sources of energy. Electricity is a secondary energy source that is generated from primary sources of energy.
Energy sources are measured in different physical units: liquid fuels in barrels or gallons, natural gas in cubic feet, coal in short tons, and electricity in kilowatts and kilowatthours. In the United States, British thermal units (Btu), a measure of heat energy, is commonly used for comparing different types of energy to each other. In 2015, total U.S. primary energy consumption was about 97.7 quadrillion (1015, or one thousand trillion) Btu."
[eia.gov/ energyexplained/ index.cfm?page=us_ energy_ home]
The chart example "U.S. primary energy consumption by source and sector" was created using the ConceptDraw PRO diagramming and vector drawing software extended with the Divided Bar Diagrams solution from the Graphs and Charts area of ConceptDraw Solution Park.
Divided bar chart
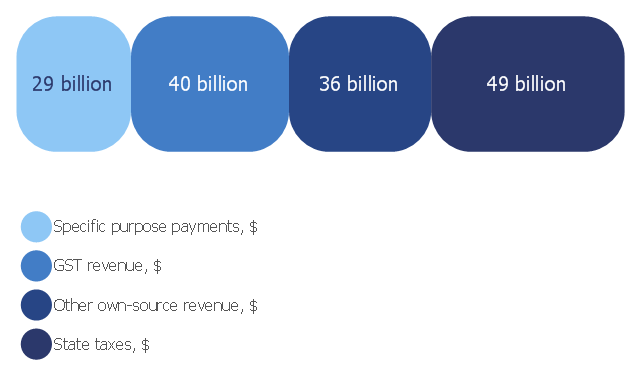
This divided bar diagram sample shows composition of Australian state government revenue in 2006‑2007. It was drawn on the base of the chart "Composition of state government revenue in 2006‑07" from the Australia's future tax system website.
[taxreview.treasury.gov.au/ content/ Paper.aspx?doc=html/ publications/ papers/ report/ section_ 10-06.htm]
"Government revenue is money received by a government. It is an important tool of the fiscal policy of the government and is the opposite factor of government spending. Revenues earned by the government are received from sources such as taxes levied on the incomes and wealth accumulation of individuals and corporations and on the goods and services produced, exported and imported from the country, non-taxable sources such as government-owned corporations' incomes, central bank revenue and capital receipts in the form of external loans and debts from international financial institutions." [Government revenue. Wikipedia]
The divided bar diagram example "Composition of state government revenue in 2006‑07" was created using the ConceptDraw PRO diagramming and vector drawing software extended with the Divided Bar Diagrams solution from the Graphs and Charts area of ConceptDraw Solution Park.
Divided bar chart
The vector stencils library "Data-driven charts" contains 13 data-driven graphs and charts: area chart, divided bar diagram, double bar graph, frequency histogram, horizontal bar chart, line graph, percentage ring chart, percentage pie chart, scatter plot, column chart, waterfall chart.
Use it to visualize quantitative data in your data-driven infographics.
The graphs example "Data-driven charts - Vector stencils library" was created using the ConceptDraw PRO diagramming and vector graphics software extended with the Data-driven Infographics solution from the area "What is infographics" of ConceptDraw Solution Park.
Use it to visualize quantitative data in your data-driven infographics.
The graphs example "Data-driven charts - Vector stencils library" was created using the ConceptDraw PRO diagramming and vector graphics software extended with the Data-driven Infographics solution from the area "What is infographics" of ConceptDraw Solution Park.
Area chart
Divided bar diagram
Double bar graph
Frequency histogram
Horizontal bar graph
Line graph
Percentage ring chart
Pie chart
Percentage pie chart
Ring chart
Scatter plot
Column chart (vertical bar graph)
Waterfall chart
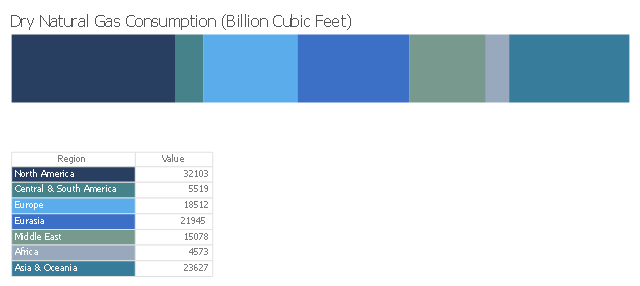
This divided bar diagram sample shows the global natural gas consumption by regions in 2013. It was designed using data of the International Energy Statistics webpage from the U.S. Energy Information Administration (EIA) website. [eia.gov/ cfapps/ ipdbproject/ IEDIndex3.cfm?tid=3&pid=26&aid=2]
"Natural gas is a fossil fuel formed when layers of buried plants and animals are exposed to intense heat and pressure over thousands of years. The energy that the plants originally obtained from the sun is stored in the form of chemical bonds in natural gas. Natural gas is a nonrenewable resource because it cannot be replenished on a human time frame. Natural gas is a hydrocarbon gas mixture consisting primarily of methane, but commonly includes varying amounts of other higher alkanes and even a lesser percentage of carbon dioxide, nitrogen, and hydrogen sulfide. Natural gas is an energy source often used for heating, cooking, and electricity generation. It is also used as fuel for vehicles and as a chemical feedstock in the manufacture of plastics and other commercially important organic chemicals." [Natural gas. Wikipedia]
The chart example "Global natural gas consumption" was created using ConceptDraw PRO diagramming and vector drawing software extended with the Divided Bar Diagrams solution from the Graphs and Charts area of ConceptDraw Solution Park.
Divided bar chart
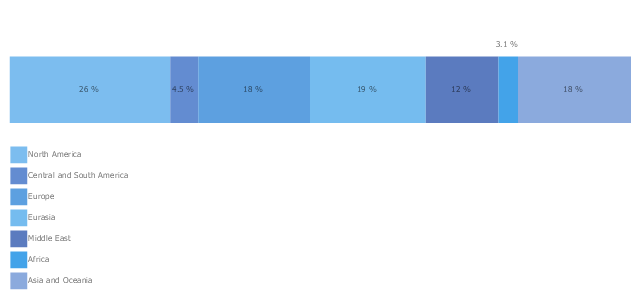
This divided bar chart sample shows the global natural gas consumption in 2010. It was designed on the base of data on the webpage "International Energy Statistics" from the U.S. Energy Information Administration (EIA) website. [eia.gov/ cfapps/ ipdbproject/ IEDIndex3.cfm?tid=3&pid=26&aid=2]
"Natural gas is a fossil fuel formed when layers of buried plants and animals are exposed to intense heat and pressure over thousands of years. The energy that the plants originally obtained from the sun is stored in the form of chemical bonds in natural gas. Natural gas is a nonrenewable resource because it cannot be replenished on a human time frame. Natural gas is a hydrocarbon gas mixture consisting primarily of methane, but commonly includes varying amounts of other higher alkanes and even a lesser percentage of carbon dioxide, nitrogen, and hydrogen sulfide. Natural gas is an energy source often used for heating, cooking, and electricity generation. It is also used as fuel for vehicles and as a chemical feedstock in the manufacture of plastics and other commercially important organic chemicals." [Natural gas. Wikipedia]
The divided bar graph example "Global natural gas consumption" was created using ConceptDraw PRO diagramming and vector drawing software extended with the Basic Divided Bar Diagrams solution from the Graphs and Charts area of ConceptDraw Solution Park.
Divided bar chart
The vector stencils library "Education charts" contains 12 graphs and charts: area chart, column chart, divided bar diagram, histogram, horizontal bar graph, line graph, pie chart, ring chart, scatter plot.
Use it to create your education infogram in the ConceptDraw PRO diagramming and vector drawing software.
The vector stencils library "Education charts" is included in the Education Infographics solution from the Business Infographics area of ConceptDraw Solution Park.
Use it to create your education infogram in the ConceptDraw PRO diagramming and vector drawing software.
The vector stencils library "Education charts" is included in the Education Infographics solution from the Business Infographics area of ConceptDraw Solution Park.
Area chart - serial
Column chart
Column chart - serial
Divided bar diagram
Frequency histogram
Horizontal bar chart
Horizontal bar chart - serial
Line chart - serial
Pie chart
Ring chart
Scatter plot
Scatter plot - serial
- How to Draw a Divided Bar Chart in ConceptDraw PRO | Divided ...
- Basic Divided Bar Diagrams | Sales Growth. Bar Graphs Example ...
- How to Draw a Divided Bar Chart | Divided Bar Diagrams | Stacked ...
- Electrical Engineering | Bar Graphs | Divided Bar Diagrams | Bar ...
- How to Draw a Divided Bar Chart in ConceptDraw PRO | Bar ...
- Divided Bar Diagrams | Bar Diagrams for Problem Solving. Create ...
- Divided Bar Diagrams | How to Draw a Divided Bar Chart in ...
- Geo Map - Asia - Philippines | Bar Diagram Math | Basic Divided Bar ...
- How to Draw a Divided Bar Chart in ConceptDraw PRO | Sales ...