
The vector stencils library Comparison charts contains 4 Live Objects: Horizontal
bar chart, Column chart (Vertical bar chart), Line chart and Dot plot (Scatter
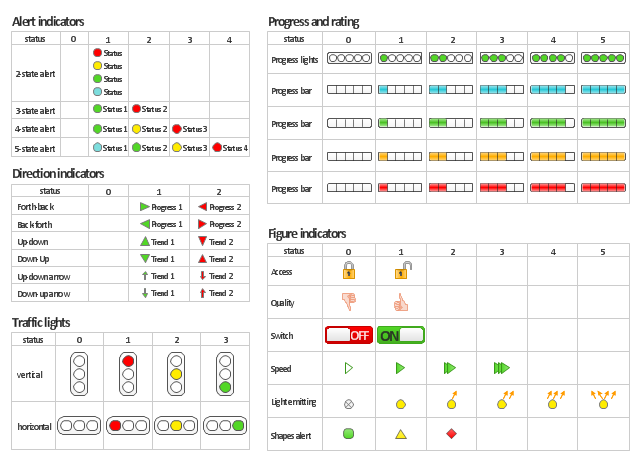
The vector stencils library " Comparison indicators " contains 6 comparison
indicators . Comparison indicators are Live Objects which show the comparison of
two
Two Up Arrows Indicator shows the comparison of two items. Especially useful for
two items with same direction. Library: Comparison Indicators .cdl. Solution:
 Comparison Dashboard Solution. ConceptDraw.com
Comparison dashboard solution extends ConceptDraw DIAGRAM software with
samples, templates and vector stencils library with charts and indicators for
The vector stencils library Comparison indicators contains 7 Live Objects: Two
column indicator , Two bubbles indicator , Scales indicator , Left and right arrows

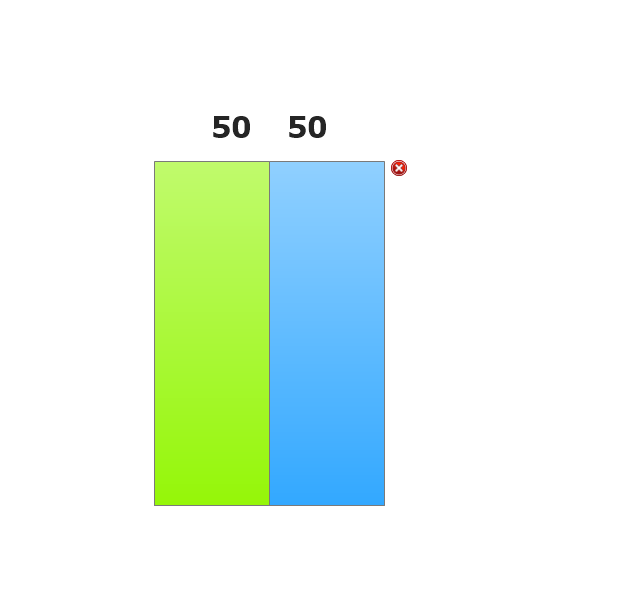
The vector stencils library "Composition indicators " contains 6 templates of Use
these design elements to visualize composition comparison of your data in

The vector stencils library "Composition indicators " contains 6 dashboard graphic
Composition Indicators useful for: • comparison of one part with the total
 Composition Dashboard Solution. ConceptDraw.com
Other features may include indicators for low fuel, low tire pressure and faults in
. displays your source data to visually communicate Composition Comparison .
Making Dashboards Useful Again. Part 0. *

Making Dashboards Useful Again. Part 0.
Have you ever used dashboards? You probably have, and not just once. Speedometer, tachometer, fuel and oil level indicators, clock, and GPS – this is a typical set of instrumentation that can be found on a car dashboard. Even though all of these indicators are present, an experienced driver feels the speed and engine rpm with sufficient accuracy without looking at the dashboard consistently. The dashboard is an important tool in the car, but not necessarily an irreplaceable one: we need all these indicators to be available while driving, but for 99% of the time they are superfluous.
 Dashboard Software. ConceptDraw.com
May 21, 2016 Use these visual indicators to display productivity reports, sales efforts onto a
single document, allowing for the comparison and analysis of

Key performance indicators , balanced scorecards, and sales performance figures
are some of the content appropriate on business dashboards." [Dashboard
 Meter Dashboard Solution. ConceptDraw.com
This sale dashboard contains different performance meter indicators : two radial
. compact Bullet Indicators as a stack to compare related metrics “at-a-glance”
Dashboards are usually a series of graphics, charts, gauges and other visual
indicators that can be monitored and interpreted. Even when there is a strategic

The vector stencils library "Meter indicators " contains 29 Live Objects:
speedometer gauge, dial, bullet graph, slider and level meter visual indicators .
The Live
 Status Dashboard Solution. ConceptDraw.com
Status dashboard solution extends ConceptDraw DIAGRAM software with
templates, samples and vector stencils libraries with graphic indicators for
drawing the

The vector stencils library "Marketing indicators " contains 12 graphic indicators :
horizontal bar chart, pie chart, arrow chart, donut chart, square chart, stickman

Compare (diamond), compare ,. Compare (square). Compare (square), compare ,.
Completed form Decision indicator - Yes. Decision indicator - Yes, decision

The vector stencils library "Status indicators " contains 41 visual status indicators .
Each status indicator can visualize one of 2-6 information states and have a


The vector stencils library "Management indicators " contains 14 visual indicators .
Use it to create your management infogram in the ConceptDraw PRO
- Comparison indicators - Vector stencils library | Design elements ...
- Comparison indicators - Vector stencils library
- Comparison indicators - Vector stencils library
- Design elements - Comparison charts and indicators | Design ...
- Comparison indicators - Vector stencils library | Sales arrows ...
- Design elements - Comparison charts and indicators | Comparison ...
- Comparison Dashboard | Design elements - Comparison charts and ...
- Feature Comparison Chart Software | Financial Comparison Chart ...
- Design elements - Comparison charts and indicators
- Design elements - Composition charts and indicators | Basic Pie ...
- Composition indicators - Vector stencils library | Design elements ...
- Design elements - HR arrows | Design elements - Comparison ...
- Balanced Scorecard Software | ConceptDraw Solution Park | Design ...
- How to Connect Text Data to a Time Series Chart on Your Live ...
- Comparison Dashboard | Business Intelligence Dashboard ...
- Comparison Dashboard | Feature Comparison Chart Software ...
- Examples Of Visual Indicators
- Arrows - Vector clipart library | HR arrows - Vector stencils library ...
- Composition indicators - Vector stencils library | Design elements ...
- How to Connect a Live Object to a Text Data Source | How to Create ...