A Wiring Diagram is a comprehensive schematic that depicts the electrical circuit system, shows all the connectors, wiring, signal connections (buses), terminal boards between electrical or electronic components and devices of the circuit. Wiring Diagram illustrates how the components are connected electrically and identifies the wires by colour coding or wire numbers. These diagrams are necessary and obligatory for identifying and fixing faults of electrical or electronic circuits, and their elimination. For designing Wiring Diagrams are used the standardized symbols representing electrical components and devices.
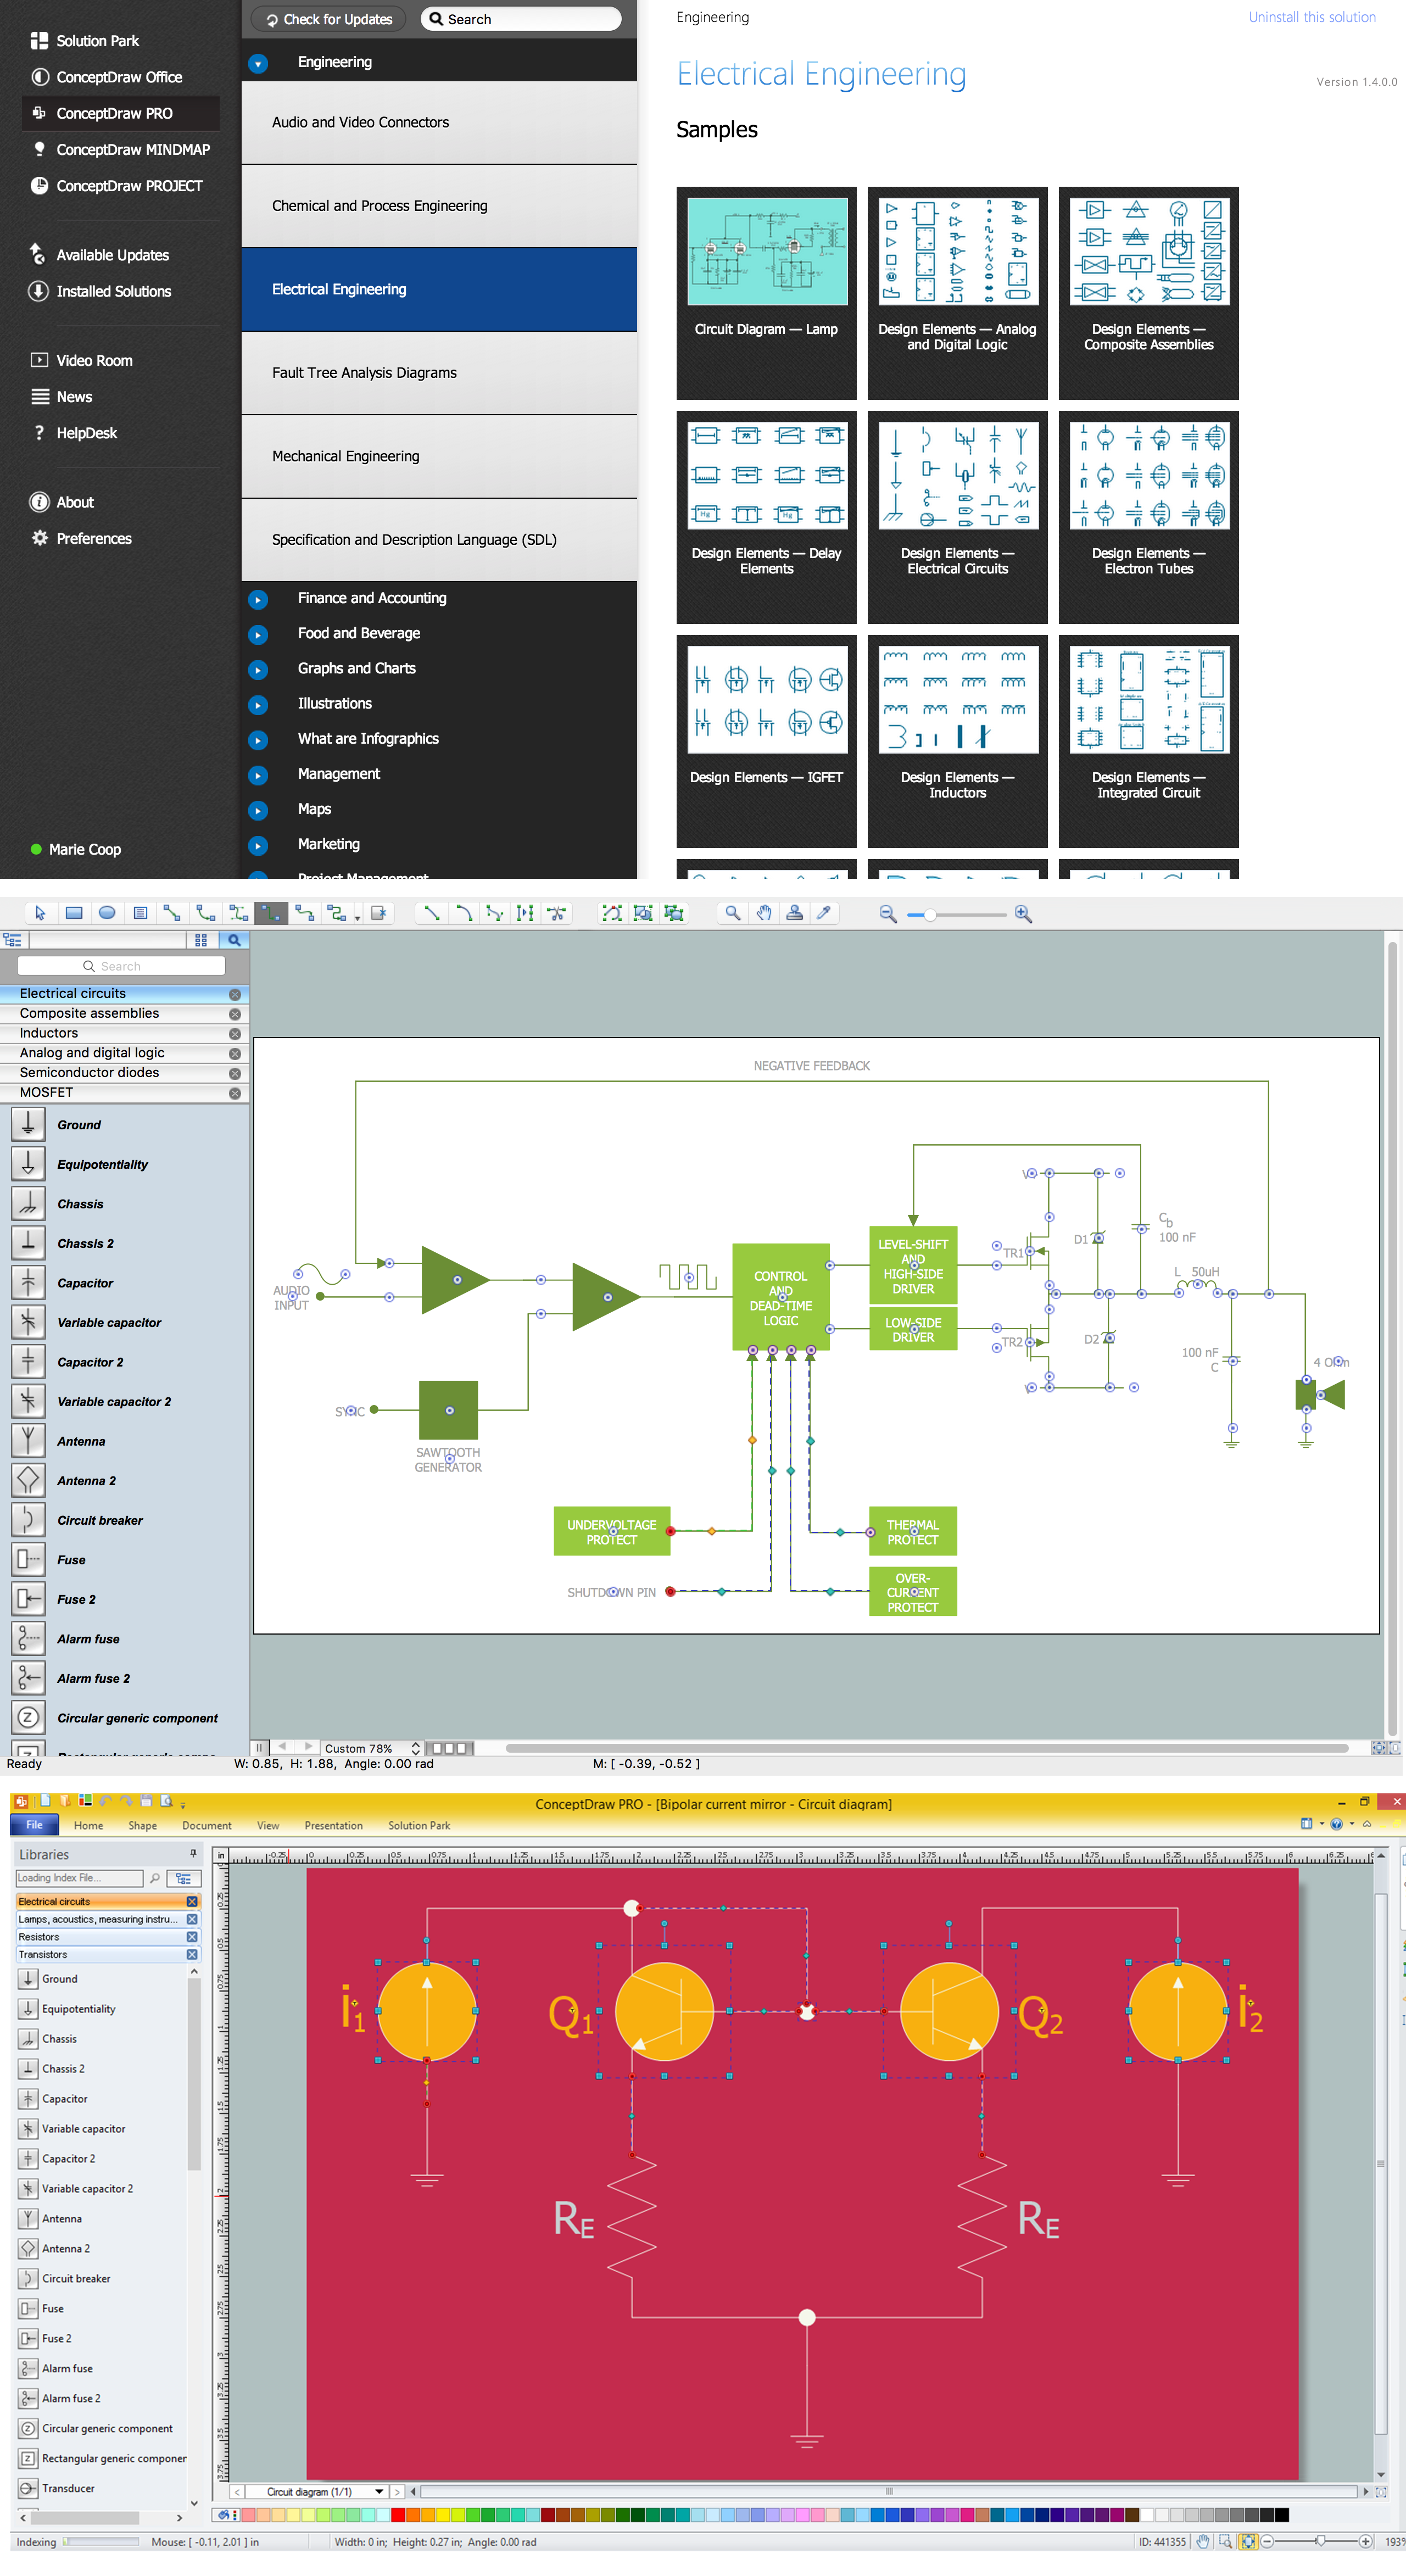
ConceptDraw Solution Park offers the Electrical Engineering solution from the Engineering area with 26 libraries of graphics design elements and electrical schematic symbols for easy drawing various Wiring Diagrams, Electrical Circuit and Wiring Blueprints, Electrical and Telecom schematics of any complexity, Electrical Engineering Diagrams, Power Systems Diagrams, Repair Diagrams, Maintenance Schemes, etc. in ConceptDraw DIAGRAM software.