
What Is a Picture Graph? *

What Is a Picture Graph
What Is a Picture Graph
 Picture Graphs Solution. ConceptDraw.com
Typically, a Picture Graph has very broad usage. They many times used
successfully in marketing, management, and manufacturing. The Picture Graphs

The vector stencils library " Picture Graphs " contains 4 image chart templates. Use
it to design your pictorial bar charts in ConceptDraw PRO diagramming and
The vector stencils library " Picture Graphs " contains 35 templates of picture bar
graphs for visual data comparison and time series. Drag a template from the
 Basic Picture Graphs Solution. ConceptDraw.com
This solution extends the capabilities of ConceptDraw DIAGRAM (or later) with
templates, samples and a library of vector stencils for drawing Picture Graphs .

A picture chart ( image chart , pictorial graph) is the type of a bar graph visualizing
numarical data using symbols and pictograms. In the field of economics and

The vector stencils library " Picture bar graphs " contains 35 templates of pictorial
charts . Use it for visualization of data comparison and time series with

This picture bar graph sample shows regional population growth from 2010 to
2016. It was designed using data from the Wikipedia article List of continents by

This picture graph sample shows how does manufacturing compare with other
industries in U.S. It was designed using data from the U.S. Census Bureau

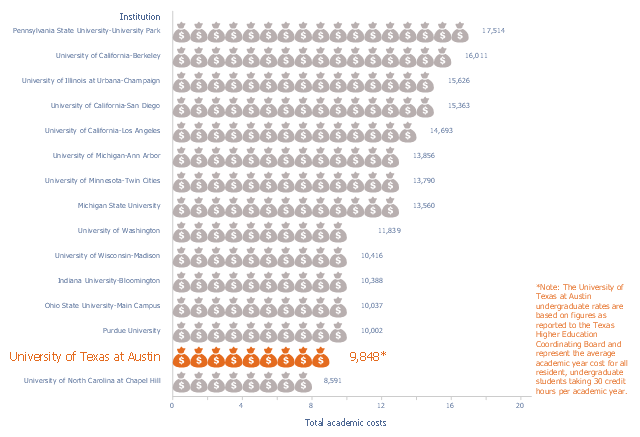
This picture bar graph sample shows the UT Austin Tuition Ranks 6th Compared
to Other Texas Public Universities (Tuition and fees per semester, fall 2015).
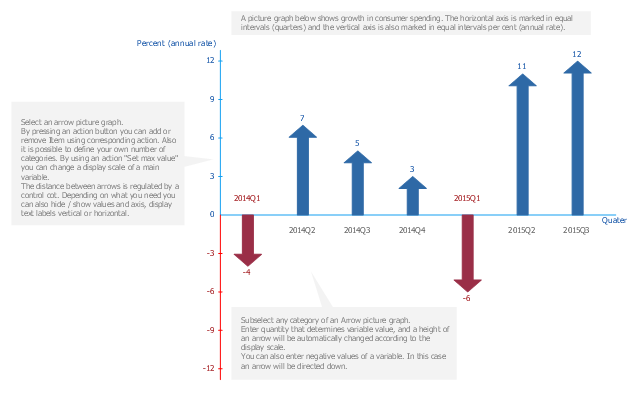
Financial Comparison Chart *

Financial Comparison Chart .
Financial Comparison ChartTo show data increase or decrease use arrows bar charts. The arrow chart
template " Picture graph " for the ConceptDraw PRO diagramming and vector
drawing
Pictures of Vegetables *

Pictures of Vegetables
Pictures of Vegetables
This picture bar graph sample shows the Barrie population growth from 1981 to
2006. It was designed on the base of the Wikimedia Commons file: Barrie
Scatter Graph Charting Software *

Scatter Graph Charting Software
Scatter chart example - German tax rate on corporate income 1995-2009

- Picture graph - Template
- Picture Graphs
- Design elements - Picture bar graphs | Picture Graph Or Pictograph
- Gantt chart examples | Chart Maker for Presentations | What Is a ...
- Picture graphs - Vector stencils library
- Picture Graphs | Competitor Analysis | What Is a Picture Graph ...
- Picture Graphs
- Picture graph - Template
- Design elements - Picture bar graphs | Picture graphs - Vector ...
- Bar Graphs | Sales Growth. Bar Graphs Example | Picture Graphs ...
- Picture graph - Template | Manufacturing in America | Total value of ...
- Picture Graphs
- Design elements - Picture graphs | Picture graph - Template | Picture ...
- Barrie population - Picture bar graph
- How to Create a Picture Graph | Competitor Analysis | Marketing ...
- Pictures of Graphs | Chart Maker for Presentations | Picture Graph ...
- A Picture Of A Block Graph
- Barrie population - Picture bar graph | Design elements - Picture bar ...
- Design elements - Marketing charts | Picture Graphs | Marketing ...
- How to Create a Picture Graph in ConceptDraw PRO | Design ...