Pie Graph
When you need to draw a Pie Graph, you look the useful tools. ConceptDraw DIAGRAM diagramming and vector drawing software extended with Pie Charts solution from the Graphs and Charts area will effectively help you in your Pie Graph drawing.
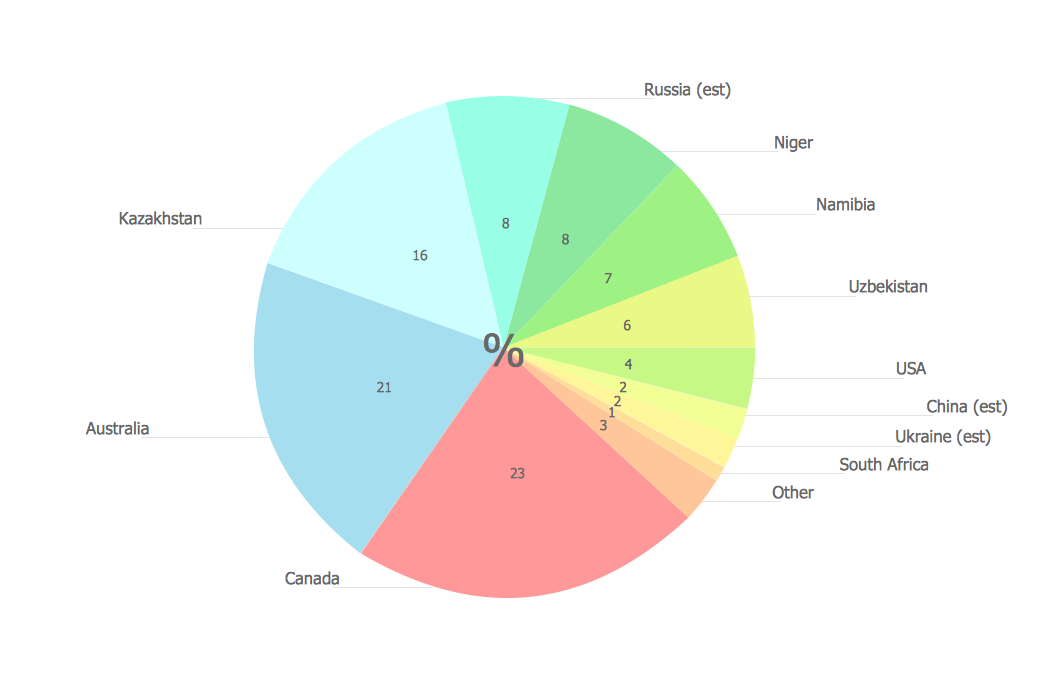
Example 1. Pie Graph - 2007 Uranium
Pie Charts Solution from the Graphs and Charts area offers you the large collection of predesigned templates and samples, and library with ready-to-use vector objects. Templates and samples can be used as the examples or the base for your Pie Graphs.

Example 2. Pie Charts Solution in ConceptDraw STORE
If you want to draw your new Pie Graph using the ready objects, you need to create the new ConceptDraw document and simply drag the desired Pie Ghaph object from the Pie Charts library. Then set your values and type the categories.

Example 3. Pie Graph - European parliament elections
This Pie Graph was created in ConceptDraw DIAGRAM using the Pie Charts solution from the Graphs and Charts area and visually shows the results of European parliament elections. An experienced user spent 10 minutes creating this sample.
The Pie Graph designed with ConceptDraw DIAGRAM is vector graphic documents and is available for reviewing, modifying, converting to a variety of formats (image, HTML, PDF file, MS PowerPoint Presentation, Adobe Flash or MS Visio), printing and send via e-mail in one moment.
THREE RELATED HOW TO's:
This sample was created in ConceptDraw DIAGRAM diagramming and vector drawing software using the Pie Charts Solution from Graphs and Charts area of ConceptDraw Solution Park.
This sample shows the Pie Chart of the approximate air composition. You can see the percentage of oxygen, nitrogen and other gases in the air visualized on this Pie Chart.
Picture: Percentage Pie Chart. Pie Chart Examples
Related Solution:
These donut chart templates was designed using ConceptDraw DIAGRAM diagramming and vector drawing software extended with Pie Charts solution from Graphs and Charts area of ConceptDraw Solution Park.
All these donut chart templates are included in the Pie Charts solution.
You can quickly rework these examples into your own charts by simply changing displayed data, title and legend texts.
Picture: Donut Chart Templates
Related Solution:
A pie chart is a circular diagram showing a set of data divided into proportional slices. There are several variations of this chart such as donut chart, exploded pie chart, multi-level pie charts. Although it is not very informative when a ring chart or circle chart has many sections, so choosing a low number of data points is quite important for a useful pie chart.
ConceptDraw DIAGRAM software with Pie Charts solution helps to create pie and donut charts for effective displaying proportions in statistics, business and mass media for composition comparison, i.e. for visualization of part percentage inside one total.
Picture: Pie Chart Software
Related Solution: