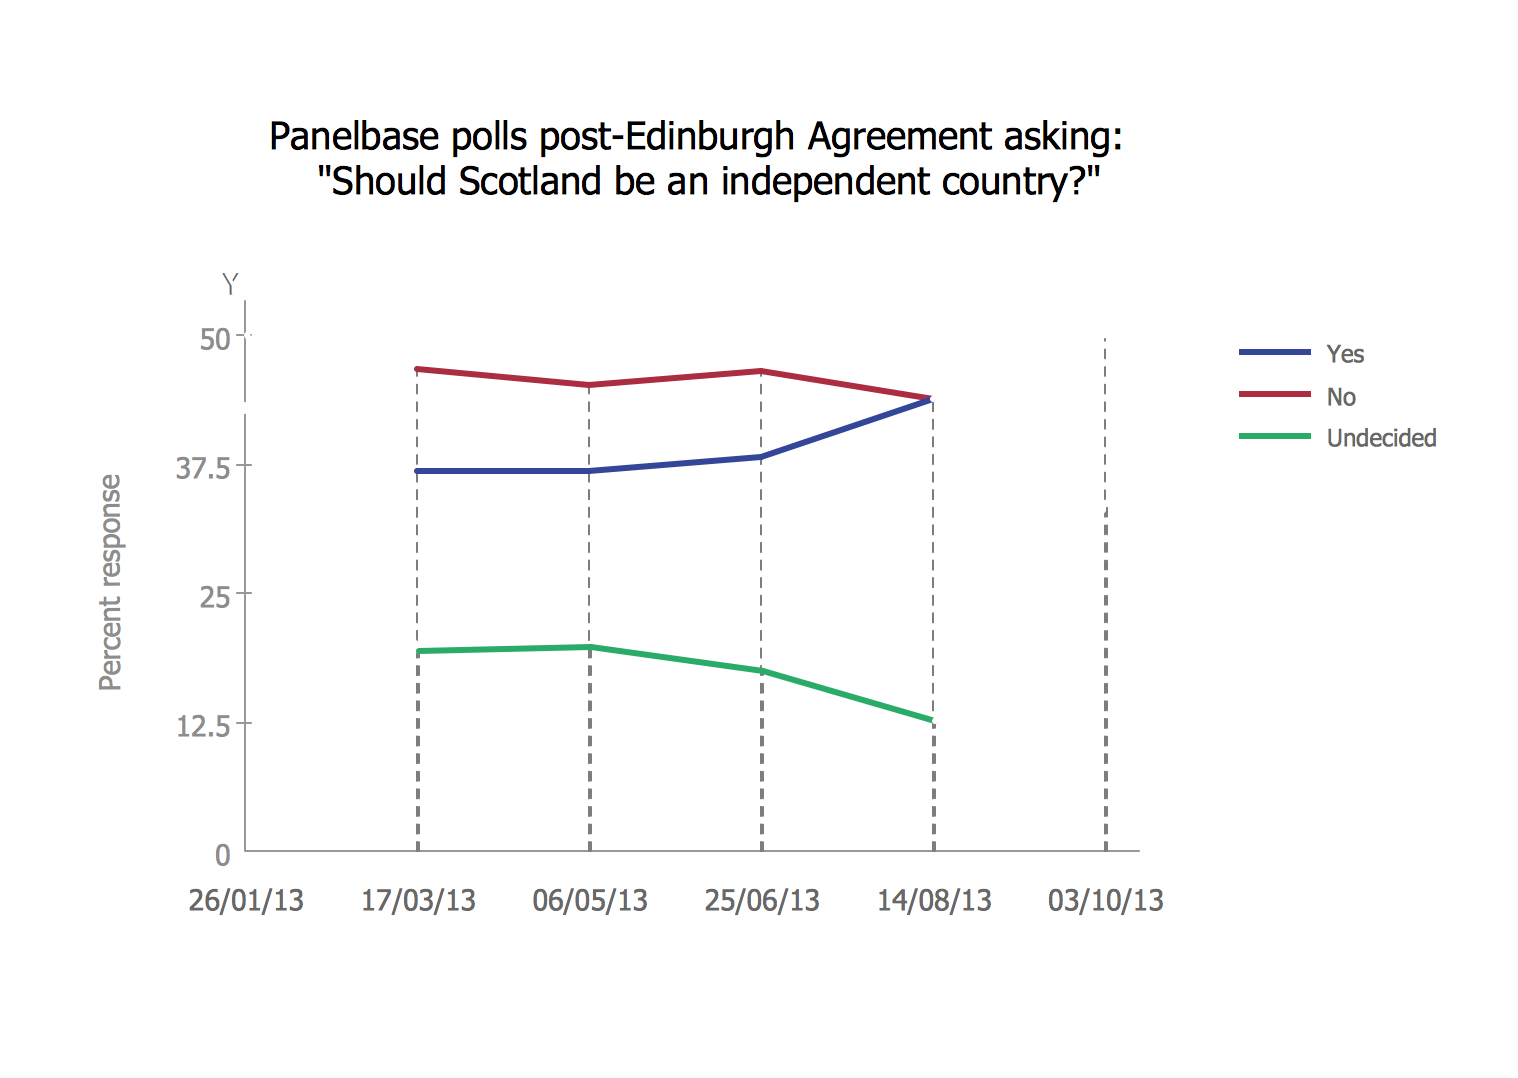
Line Chart Examples

Chart Examples

Examples of Flowcharts, Org Charts and More


Line Graph Charting Software

Gantt Chart Software

 Business Processes
Business Process solution extends ConceptDraw DIAGRAM software with business process diagrams as cross-functional flowcharts, workflows, process charts, IDEF0, timelines, calendars, Gantt charts, business process modeling, audit and opportunity flowcharts.
Line Chart Template for Word

How to Report Task's Execution with Gantt Chart

 Line Graphs
How to draw a Line Graph with ease? The Line Graphs solution extends the capabilities of ConceptDraw DIAGRAM with professionally designed templates, samples, and a library of vector stencils for drawing perfect Line Graphs.
How to Create Gantt Chart

Bar Diagrams for Problem Solving. Create business management bar charts with Bar Graphs Solution

 Time Series Dashboard
Time series dashboard solution extends ConceptDraw DIAGRAM software with templates, samples and vector stencils libraries with charts, graphs and plots for drawing the visual dashboards showing data time series.
Pyramid Chart Examples

Bar Diagrams for Problem Solving. Create space science bar charts with Bar Graphs Solution

 Seven Management and Planning Tools
Seven Management and Planning Tools solution extends ConceptDraw DIAGRAM and ConceptDraw MINDMAP with features, templates, samples and libraries of vector stencils for drawing management mind maps and diagrams.
Scatter Chart Analysis. Scatter Chart Example
"Value Stream Mapping (VSM):
– Special type of flow chart that uses symbols known as "the language of Lean" to depict and improve the flow of inventory information. ...
Value Stream Mapping ...
Provide optimum value to the customer through a complete value creation process with minimum waste in:
– Design (concept to customer);
– Design (concept to customer);
– Build (order to delivery);
– Sustain (in-use through life cycle to service)." [courses.washington.edu/ ie337/ Value_ Stream_ Mapping.pdf]
This sample Value Stream Map shows how customer value is created in the steps of manufacturing, production control, and shipping processes.
This VSM example was created using the ConceptDraw PRO diagramming and vector drawing software extended with the Value Stream Mapping solution from the Quality area of ConceptDraw Solution Park.
Value stream mapping

Pyramid Diagram

Pyramid Diagram

- Timeline Diagrams | Timeline diagram template | Project timeline ...
- Timeline Diagrams | Line Chart Examples | Line Graph Charting ...
- Timeline Diagrams | Line Chart Examples | Value stream map ...
- Business Processes | Timeline Diagrams | Business diagrams & Org ...
- Project timeline diagram
- Project timeline diagram - New business project plan ...
- Timeline Diagrams | Value stream map example | Value stream ...
- Design elements - Timelines solution | Timeline diagram template ...
- Timeline Diagrams | Business diagrams & Org Charts with ...
- Timeline diagram template | Timeline diagram | Project timeline ...
- Project timeline - Request for proposal plan | PERT chart - Request ...
- Timeline Diagrams | Marketing | Management |
- Value stream map example | Timeline Diagrams | Communication ...
- Communication Tool for Remote Project Management | Timeline ...
- Timeline Diagrams | Timeline diagram template | Timeline diagram ...
- Line Chart Examples | How to Create a Line Chart | Line Graph ...
- Timeline Diagrams | Communication Tool for Remote Project ...
- How to Create a Scatter Chart | Scatter Chart Examples | Line Graph ...
- Timeline Diagrams | Management | Business Processes |
- Timeline Diagrams | Timeline diagram template | Seven ...