Scatter Graph Charting Software

 Scatter Diagrams
The Scatter Diagrams solution extends ConceptDraw DIAGRAM functionality with templates, samples, and a library of vector stencils that make construction of a Scatter Plot easy. The Scatter Chart Solution makes it easy to design attractive Scatter Diagrams used in various fields of science, work, and life activities. ConceptDraw DIAGRAM lets you enter the data to the table and construct the Scatter Plot Graph automatically according to these data.
HelpDesk
How to Draw a Scatter Diagram

Scatter Graph

Scatter Chart Examples

Scatter Plot

Scatter Diagram
Use this template to design your scatter charts.
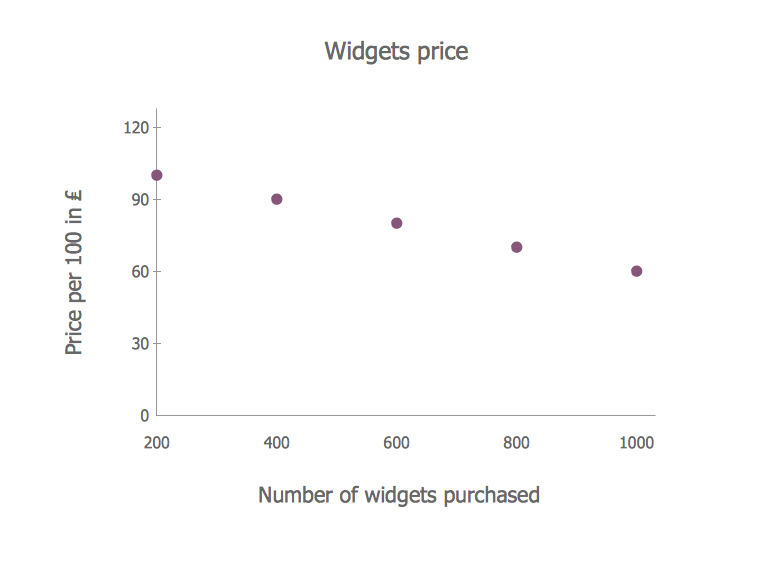
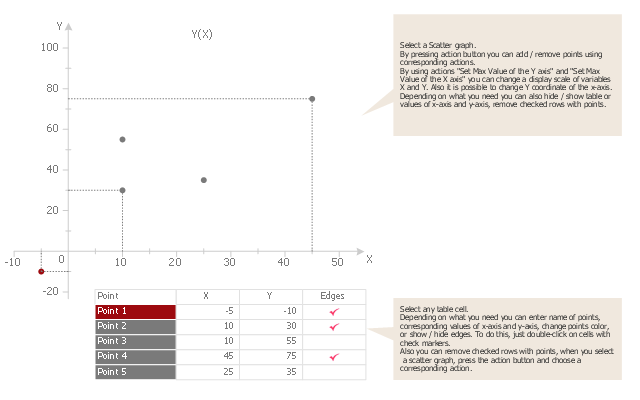
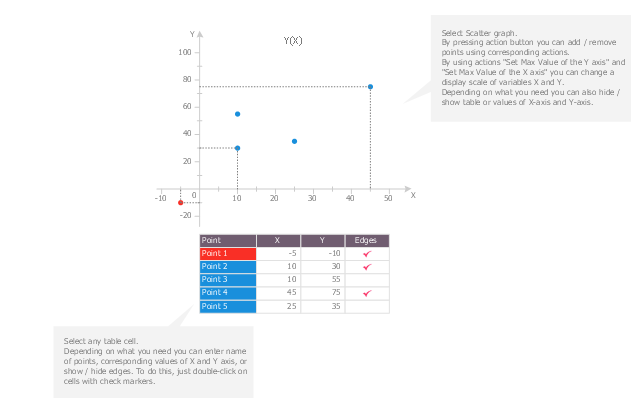
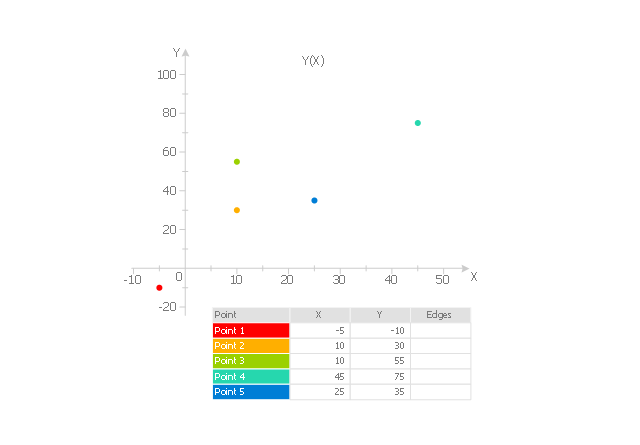
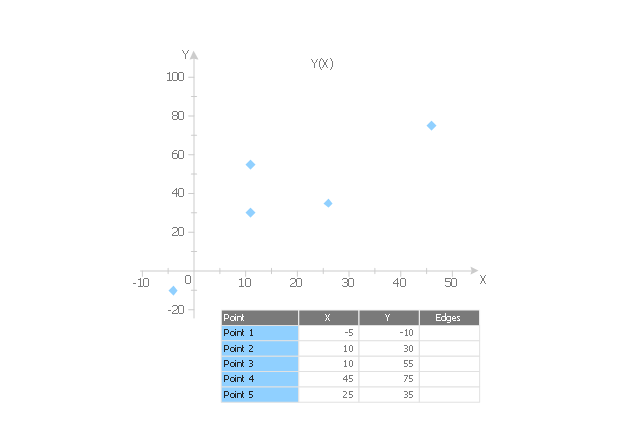
"A scatter plot, scatterplot, or scattergraph is a type of mathematical diagram using Cartesian coordinates to display values for two variables for a set of data.
The data is displayed as a collection of points, each having the value of one variable determining the position on the horizontal axis and the value of the other variable determining the position on the vertical axis. This kind of plot is also called a scatter chart, scattergram, scatter diagram, or scatter graph." [Scatter plot. Wikipedia]
The template "Scatter graph" for the ConceptDraw PRO diagramming and vector drawing software is included in the Scatter Diagrams solution from the Graphs and Charts area of ConceptDraw Solution Park.
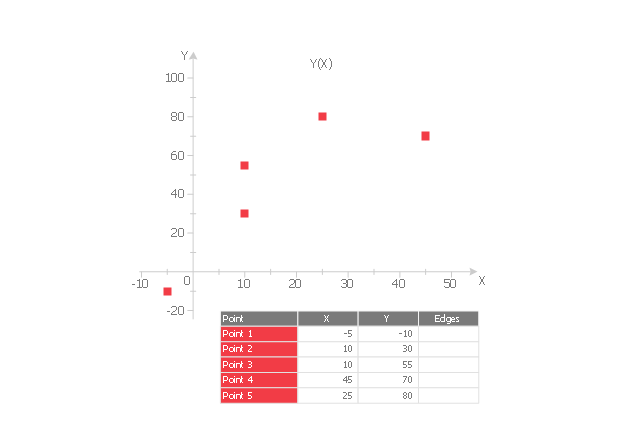
Template
Use this scatter plot template to show values for two variables for your data series in ConceptDraw PRO diagramming and vector drawing software.
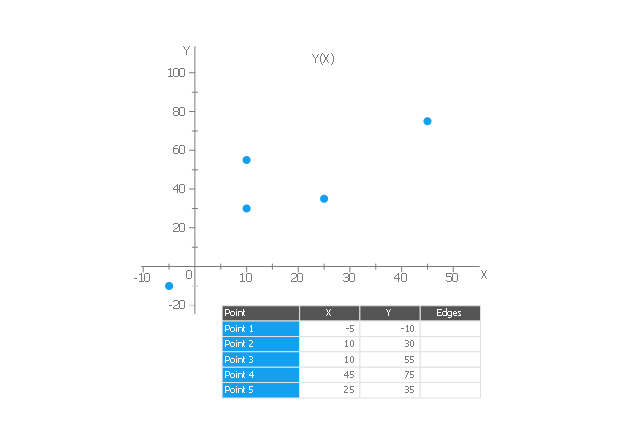
"A scatter plot, scatterplot, or scattergraph is a type of mathematical diagram using Cartesian coordinates to display values for two variables for a set of data.
The data is displayed as a collection of points, each having the value of one variable determining the position on the horizontal axis and the value of the other variable determining the position on the vertical axis. This kind of plot is also called a scatter chart, scattergram, scatter diagram, or scatter graph." [Scatter plot. Wikipedia]
The chart template "Scatter graph" is included in the Basic Scatter Diagrams solution from the Graphs and Charts area of ConceptDraw Solution Park.
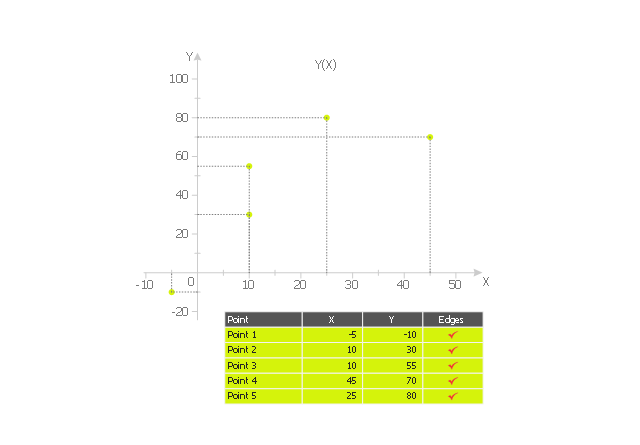
Template
The vector stencils library "Scatter graphs" contains 7 templates of scatter diagrams (scattergraphs, scatter charts, scatter plots, scatterplots, scatter diagrams) for visual analysis of correlation between two variables.
Use these shapes to draw your scatterplots in the ConceptDraw PRO diagramming and vector drawing software.
The vector stencils library "Scatter graphs" is included in the Scatter Diagrams solution of the Graphs and Charts area in ConceptDraw Solution Park.
Use these shapes to draw your scatterplots in the ConceptDraw PRO diagramming and vector drawing software.
The vector stencils library "Scatter graphs" is included in the Scatter Diagrams solution of the Graphs and Charts area in ConceptDraw Solution Park.
Scatter graph 1
Scatter graph 2
Scatter graph 3
Scatter graph 4
Scatter graph 5
Scatter graph 6
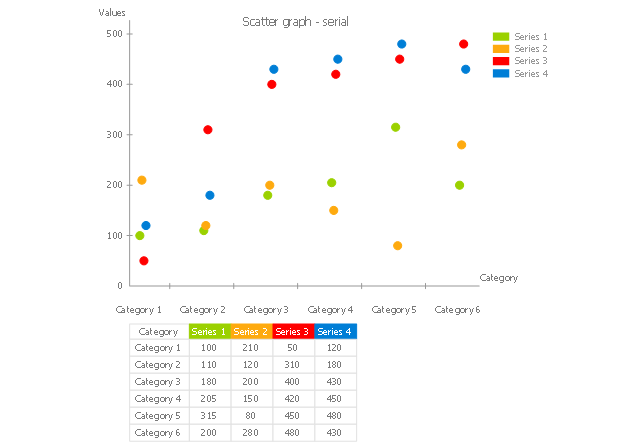
Scatter graph - serial
- Scatter Chart Examples | Scatter Diagrams | How to Draw a Scatter ...
- Scatter Diagrams | How to Draw a Scatter Diagram Using ...
- Basic Diagramming | Scatter Graph | How To Create Restaurant ...
- Scatter Diagrams | Best Diagramming | Scatter Graph | Mind Map ...
- Scatter Diagrams | Blank Scatter Plot | Scatter Chart Examples ...
- Scatter Diagrams | Basic Scatter Diagrams | Total Quality ...
- How to Draw a Scatter Diagram Using ConceptDraw PRO | Scatter ...
- Scatter Diagrams | Blank Scatter Plot | How to Draw a Scatter ...
- Baby height by age | Scatter Diagrams | Baby Age And Height ...