Products
Solutions
Samples
Contact Us
Buy
Helpdesk
✕
Sign In
Sign In
My ConceptDraw
Profile
Cart 
Activate
My Activated Licenses
Upgrade Information
Download Product
Open Support Ticket
Sign Out
This site uses cookies. By continuing to browse the ConceptDraw site you are agreeing to our Use of Site Cookies.
Helpdesk  >  ConceptDraw DIAGRAM  >    Business-specific Drawings

How to Draw a Scatter Diagram

A Scatter diagram visualizes the data as a set of points in a coordinate system. A Scatter chart has two value axes, showing one set of numerical data along the x-axis and another along the y-axis. It combines these values into single data points and displays them in uneven intervals. Making a Scatter Diagram involves many different elements that can be managed using ConceptDraw DIAGRAM The ability to design block diagrams is delivered by the Scatter Diagrams solution.
  1. Run ConceptDraw DIAGRAM.
  2. Find “Scatter Diagrams“ in the Solutions panel.
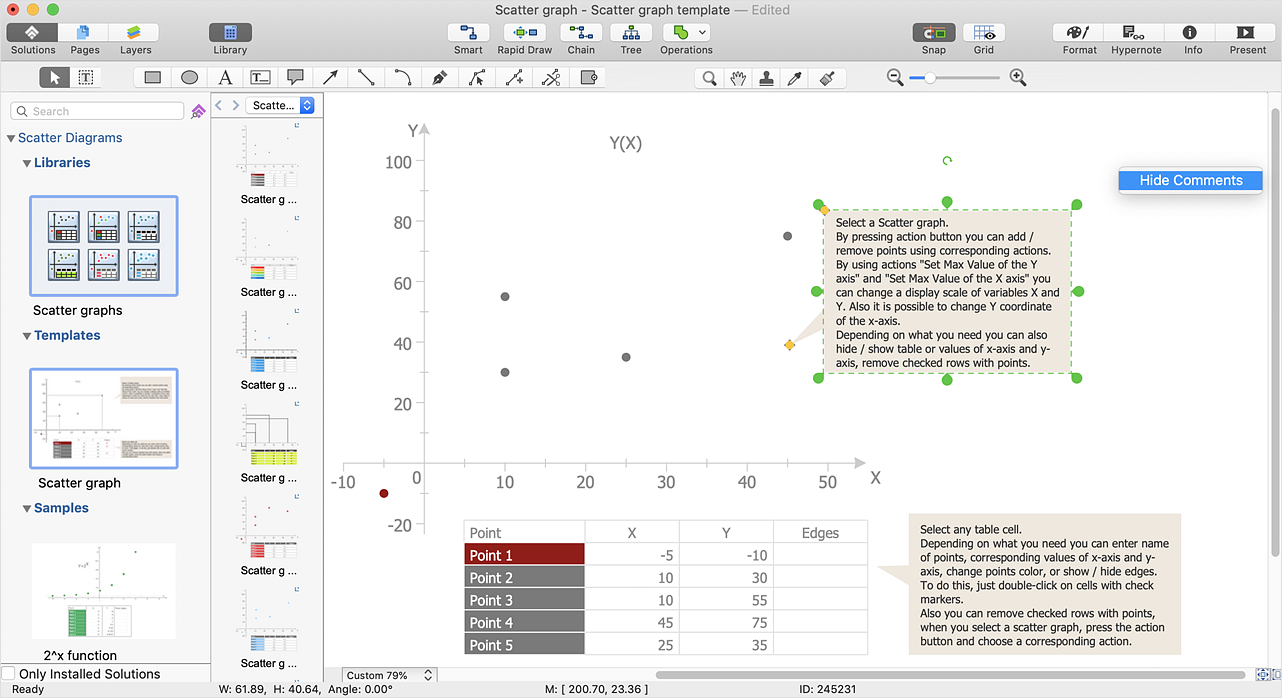
  3. Click the preview of Scatter Graph template to open the template.
  4. The template provides you with a workspace and a library required to create a scatter chart.
  5. Besides that, the scatter chart template includes some onscreen tips that can be helpful for task completion. You can hide tips using the Action button action button menu.
  6. create-scatter-chart
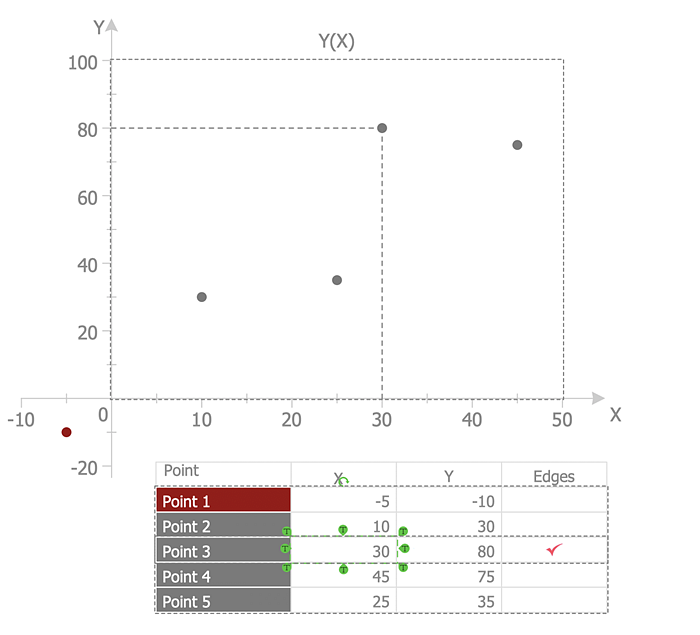
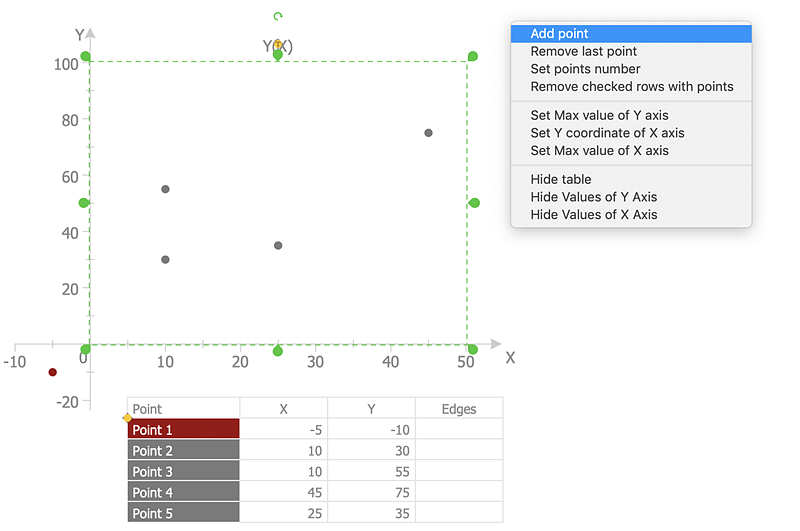
  7. Select Scatter graph and use the Action button  menu to add/remove points or change the axis appearance.
  8. create-scatter-chart
  9. To plot the data in the chart using the table click a table cell and enter the value of a point on the coordinate axes. To change the position of a point just change the value of the data in the table.
  10. create-scatter-chart
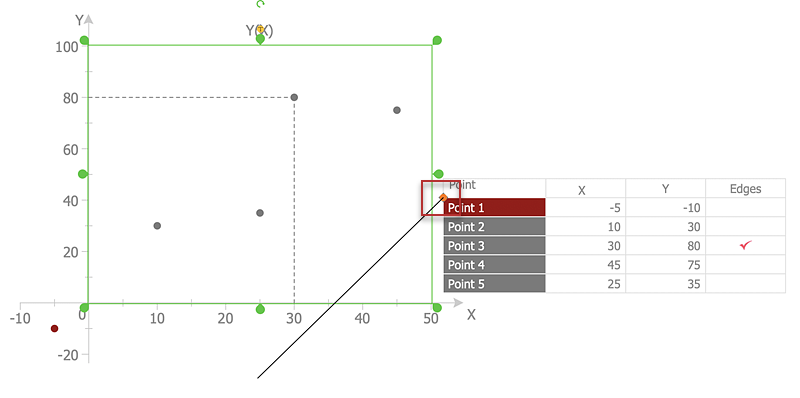
  11. Use the control dot at the upper-left corner of the table to move it through your drawing.
  12. create-scatter-chart
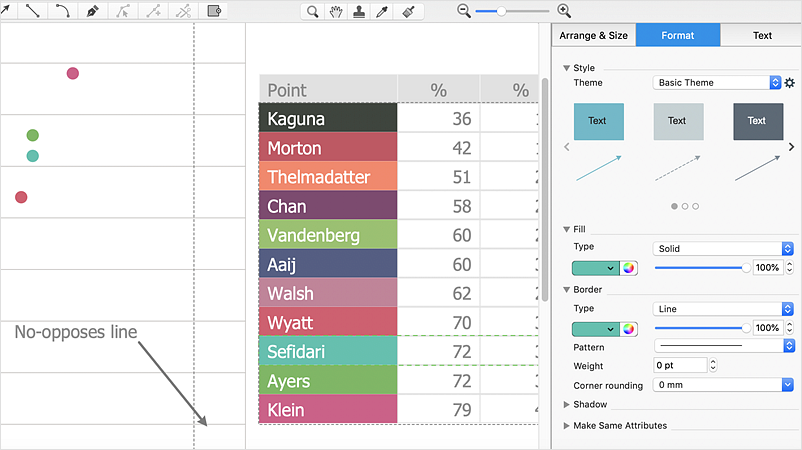
  13. You can customize color of points using Fill too lprovided in the Format panel.
  14. create-scatter-chart

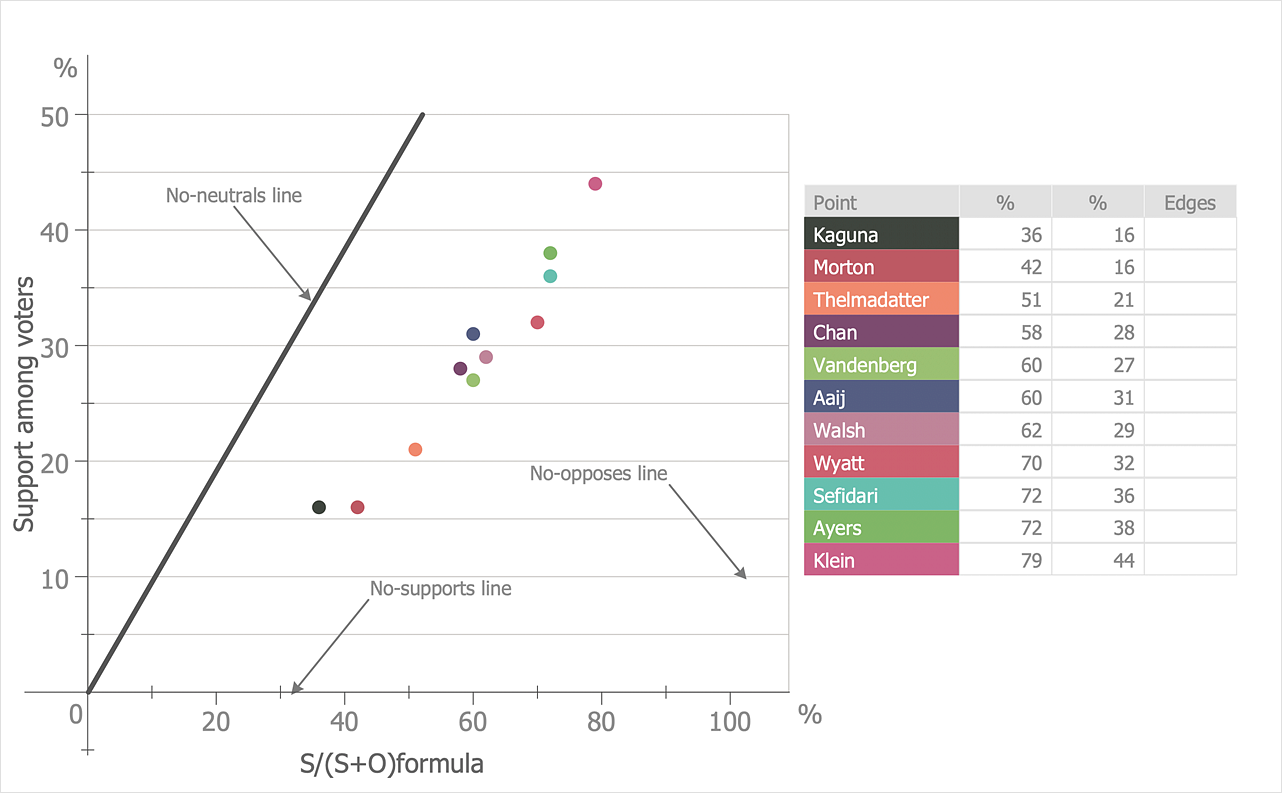
Result: Scatter Diagrams are used to visualize how a change in one variable affects another. It is very useful to for identifying relationships between variables, for example, the relationship of price and quality rating.

How to Draw a Scatter Diagram

How it works:

  • Set of ready-to-use templates supplied with ConceptDraw DIAGRAM
  • Collection of professional samples supports each template
  • Professional drawing tools

Useful Solutions and Products:

Graphs and Charts
  • Easily draw different charts
  • Visualize business information
  • Capture a different phases of the project, using diagrams

Business Processes
  • Cross-Functional Flowcharts
  • Event-driven Process Chain Diagrams
  • Business Process Model and Notation (BPMN 2.0)
  • Workflow Diagrams

ConceptDraw DIAGRAM
  • Diagraming and Charts
  • Business Process diagrams
  • Business Process Modeling Notation (BPMN 2.0)
  • Business Model Presentation
  • Over 10 000 vector stencils
  • Export to vector graphics files
  • Export to Adobe Acrobat® PDF
  • Export to MS PowerPoint®
  • Export to MS Visio® VSDX, VDX

Products

  • ConceptDraw OFFICE v11
  • ConceptDraw DIAGRAM v18
  • ConceptDraw MINDMAP v16
  • ConceptDraw PROJECT v15
  • ConceptDraw STORE
  • ConceptDraw BOOKS

Solutions

  • Free
  • Premium

Samples

Support

  • Technical Support
  • Upgrade Request
  • Visio File Conversion
  • System Requirements
  • Helpdesk
  • Students & Educators
  • Enterprise
  • Customer Service

Solutions

  • Free
  • Premium

Samples

Video Room

  • Products
  • Solutions

Ready To Buy

  • Buy Online
  • Reseller Partners
  • Manage Your Account
  • Download Your Software
  • CS Odessa

    • About Us
    • Contact Us
    • CS Odessa Identity
    • News
  • CS Odessa
    Plan. Do. Communicate.

    About Us | Contact Us | Feedback | EULA | Privacy | TOU | TOS
    © 1993 — 2025 CS Odessa Corp.