 Timeline Diagrams
Timeline Diagrams solution extends ConceptDraw DIAGRAM diagramming software with samples, templates and libraries of specially developed smart vector design elements of timeline bars, time intervals, milestones, events, today marker, legend, and many other elements with custom properties, helpful for professional drawing clear and intuitive Timeline Diagrams. Use it to design simple Timeline Diagrams and designate only the main project stages, or highly detailed Timeline Diagrams depicting all project tasks, subtasks, milestones, deadlines, responsible persons and other description information, ideal for applying in presentations, reports, education materials, and other documentation.
HelpDesk
How to Create a Timeline Diagram

Timeline Examples

Project Timeline

How to Make a Timeline

Timeline Diagrams

The vector stencils library "Timelines and milestones" contains 24 shapes of time scales with start and finish dates, time interval bars with progress indication and brackets, milestone, event and today markers for drawing the timeline diagrams using the ConceptDraw PRO diagramming and vector drawing software.
"A timeline is a way of displaying a list of events in chronological order, sometimes described as a project artifact. It is typically a graphic design showing a long bar labelled with dates alongside itself and (usually) events labelled on points where they would have happened. ...
Another type of timeline is used for project management. In these cases, timelines are used to help team members to know what milestones need to be achieved and under what time schedule. For example, in the case of establishing a project timeline in the implementation phase of the life cycle of a computer system." [Timeline. Wikipedia]
The example "Design elements - Timelines solution" is included in the Timeline Diagrams solution from the Management area of ConceptDraw Solution Park.
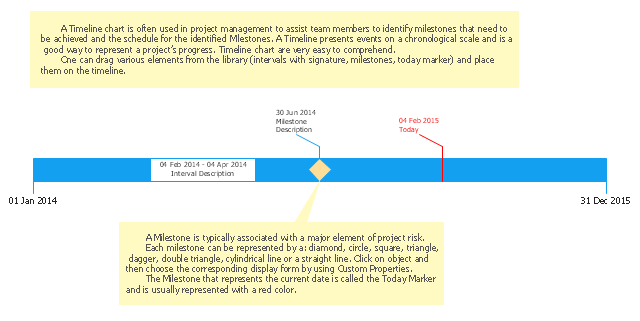
Timeline and milestone symbols

Timeline charts presents events and time periods on a chronological scale. They are used in project management to visualize project milestones and upper level phases, and show project progress.
"Within the framework of project management, a milestone is an event that receives special attention. It is often put at the end of a stage to mark the completion of a work package or phase. Milestones can be put before the end of a phase so that corrective actions can be taken, if problems arise, and the deliverable can be completed on time.
In addition to signaling the completion of a key deliverable, a milestone may also signify an important decision or the derivation of a critical piece of information, which outlines or affects the future of a project. In this sense, a milestone not only signifies distance traveled (key stages in a project) but also indicates direction of travel since key decisions made at milestones may alter the route through the project plan." [Milestone (project management). Wikipedia]
This timeline diagram example was created using the ConceptDraw PRO diagramming and vector drawing software extended with the Timeline Diagrams solution from the Management area of ConceptDraw Solution Park.
Timeline

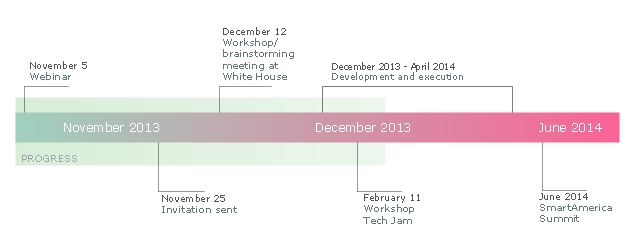
This sample was created on the base of the figure illustrating the webpage "SmartAmerica Challenge Timeline" from the website of the National Institute of Standards and Technology (NIST), an agency of the U.S. Department of Commerce. [nist.gov/ el/ sactl.cfm]
"The SmartAmerica Challenge is a White House Presidential Innovation Fellow project with the goal to bring together research in Cyber-Physical Systems (CPS) and to combine test-beds, projects and activities from different sectors, such as Smart Manufacturing, Healthcare, Smart Energy, Intelligent Transportation and Disaster Response, to show tangible and measurable benefits to the US economy and the daily lives of American citizens.
Cyber-Physical Systems is a name for the combination of the Internet of Things and System Control. So rather than just being able to “sense” where something is, CPS adds the capability to control the “thing” or allow it to interact with physical world around it.
Over 65 Companies, Government Agencies and Academic institutions came together on December 12, 2013 and launched 12 teams/ projects. Since that time 12 new projects have been formed. These teams have been hard at work over the past months building systems, prototypes, pilots and products that demonstrate the capabilities of CPS, but more importantly as the goal of the SmartAmerica Challenge they will show how these technologies will deliver socio-economic benefits to America.
The Challenge will culminate with the SmartAmerica Expo on June 11 at the Washington DC Convention Center." [smartamerica.org/ about/ ]
The timeline diagram example "" was created using the ConceptDraw PRO diagramming and vector drawing software extended with the Timeline Diagrams solution from the Management area of ConceptDraw Solution Park.
Timeline diagram
Timeline charts presents events and time periods on a chronological scale. They are used in project management to visualize project milestones and upper level phases, and show project progress.
"... timeline is used for project management. In these cases, timelines are used to help team members to know what milestones need to be achieved and under what time schedule. For example, in the case of establishing a project timeline in the implementation phase of the life cycle of a computer system." [Timeline. Wikipedia]
This project timeline diagram example was created using the ConceptDraw PRO diagramming and vector drawing software extended with the Timeline Diagrams solution from the Management area of ConceptDraw Solution Park.
Project timeline
The vector stencils library "Timelines and milestones" contains 24 shapes of timelines, time intervals, milestones.
Use it for drawing timeline and milistone diagrams in the ConceptDraw PRO diagramming and vector drawing software extended with the Timeline Diagrams solution from the Management area of ConceptDraw Solution Park.
Use it for drawing timeline and milistone diagrams in the ConceptDraw PRO diagramming and vector drawing software extended with the Timeline Diagrams solution from the Management area of ConceptDraw Solution Park.
Plane Timeline
Plane Interval

Plane Interval (Progress)
-timelines-and-milestones---vector-stencils-library.png--diagram-flowchart-example.png)
Gradient Timeline
Gradient Interval

Gradient Interval (Progress)
-timelines-and-milestones---vector-stencils-library.png--diagram-flowchart-example.png)
Stylish Timeline
Stylish Interval

Stylish Interval (Progress)
-timelines-and-milestones---vector-stencils-library.png--diagram-flowchart-example.png)
Cylindrical Timeline
Cylindrical Interval

Cylindrical Interval (Progress)
-timelines-and-milestones---vector-stencils-library.png--diagram-flowchart-example.png)
1D Timeline
Bracket interval

Diamond Milestone

Circle Milestone

X Milestone

Square Milestone

Triangle Milestone

2 Triangle Milestone

Dagger Milestone

Line Milestone

Cylindrical Milestone

Today Marker

This area chart sample shows the US federal prisoner population changes from 1914 to 2010.
"The Federal Bureau of Prisons (BOP) is a United States federal law enforcement agency. A subdivision of the U.S. Department of Justice, the Bureau is responsible for the administration of the federal prison system. The system also handles prisoners who committed acts considered felonies under the District of Columbia's law. The Bureau was established in 1930 to provide more progressive and humane care for federal inmates, to professionalize the prison service, and to ensure consistent and centralized administration of the 11 federal prisons in operation at the time.
According to its official web site, the Bureau consists of more than 116 institutions, six regional offices, its headquarters office in Washington, D.C., two staff training centers, and 22 community corrections offices, and is responsible for the custody and care of approximately 210,000 federal offenders. Approximately 82 percent of these inmates are confined in Bureau-operated correctional facilities or detention centers. The remainder are confined through agreements with state and local governments or through contracts with privately operated community corrections centers, detention centers, prisons, and juvenile facilities." [Federal Bureau of Prisons. Wikipedia]
This area graph sample was redesigned from the Wikimedia Commons file: Federal timeline US prisoners.gif. [commons.wikimedia.org/ wiki/ File:Federal_ timeline_ US_ prisoners.gif]
The area chart example "Federal timeline US prisoners" was created using the ConceptDraw PRO diagramming and vector drawing software extended with the Area Charts solution from the Graphs and Charts area of ConceptDraw Solution Park.
Area graph

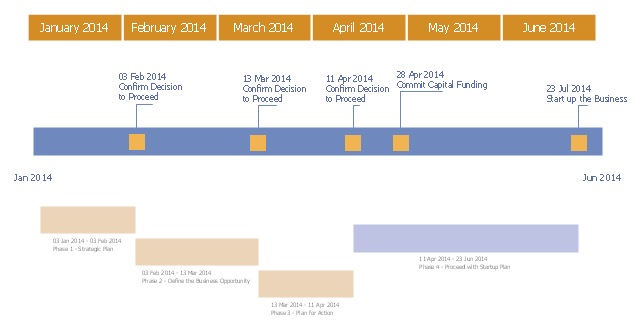
"A project plan, according to the Project Management Body of Knowledge, is: "...a formal, approved document used to guide both project execution and project control. The primary uses of the project plan are to document planning assumptions and decisions, facilitate communication among stakeholders, and document approved scope, cost, and schedule baselines. A project plan may be summarized or detailed." ...
The objective of a project plan is to define the approach to be used by the Project team to deliver the intended project management scope of the project.
At a minimum, a project plan answers basic questions about the project:
Why? - What is the problem or value proposition addressed by the project? Why is it being sponsored?
What? - What is the work that will be performed on the project? What are the major products/ deliverables?
Who? - Who will be involved and what will be their responsibilities within the project? How will they be organized?
When? - What is the project timeline and when will particularly meaningful points, referred to as milestones, be complete?" [Project plan. Wikipedia]
The timeline diagram example "New business project plan" was created using the ConceptDraw PRO diagramming and vector drawing software extended with the Timeline Diagrams solution from the Management area of ConceptDraw Solution Park.
Project timeline
"The RFP presents preliminary requirements for the commodity or service, and may dictate to varying degrees the exact structure and format of the supplier's response. Effective RFPs typically reflect the strategy and short/ long-term business objectives, providing detailed insight upon which suppliers will be able to offer a matching perspective. ...
RFP:
(1) informs suppliers that an organization is looking to procure and encourages them to make their best effort.
(2) requires the company to specify what it proposes to purchase. If the requirements analysis has been prepared properly, it can be incorporated quite easily into the Request document.
(3) alerts suppliers that the selection process is competitive.
(4) allows for wide distribution and response.
(5) ensures that suppliers respond factually to the identified requirements.
(6) is generally expected to follow a structured evaluation and selection procedure, so that an organization can demonstrate impartiality - a crucial factor in public sector procurements." [Request for proposal. Wikipedia]
The project plan timeline diagram example "Request for proposal (RFP)" was created using the ConceptDraw PRO diagramming and vector drawing software extended with the Timeline Diagrams solution from the Management area of ConceptDraw Solution Park.
Project timeline
.png--diagram-flowchart-example.png)
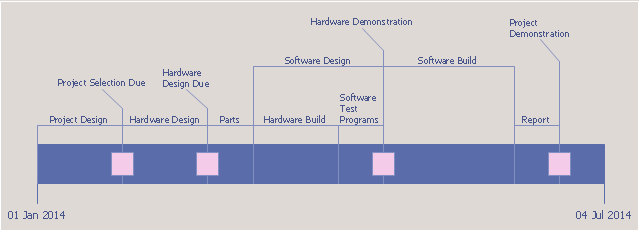
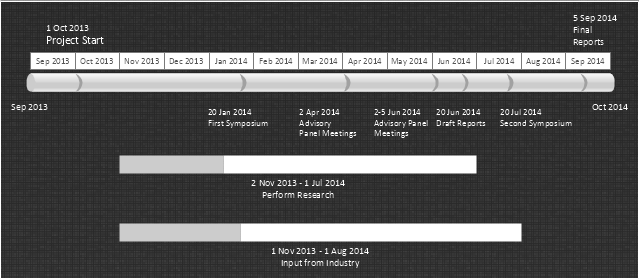
"In project management, a schedule is a listing of a project's milestones, activities, and deliverables, usually with intended start and finish dates. Those items are often estimated in terms of resource allocation, budget and duration, linked by dependencies and scheduled events. A schedule is commonly used in project planning and project portfolio management parts of project management. Elements on a schedule may be closely related to the Work Breakdown Structure (WBS) terminal elements, the Statement of work, or a Contract Data Requirements List." [Schedule (project management). Wikipedia]
The timeline diagram example "Project schedule" was created using the ConceptDraw PRO diagramming and vector drawing software extended with the Timeline Diagrams solution from the Management area of ConceptDraw Solution Park.
The timeline diagram example "Project schedule" was created using the ConceptDraw PRO diagramming and vector drawing software extended with the Timeline Diagrams solution from the Management area of ConceptDraw Solution Park.
Project schedule
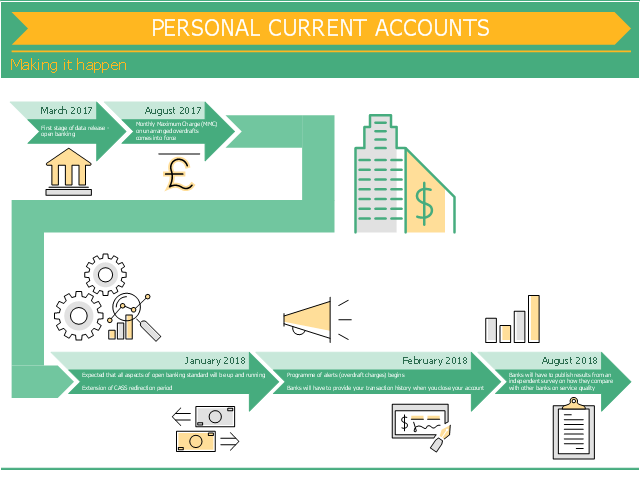
This finance infographic sample was designed on the base of the infographic "Personal current accounts Making it happen" from the the UK Government website. [gov.uk/ government/ uploads/ system/ uploads/ attachment_ data/ file/ 588882/ pcas-timeline-making-it-happen.pdf]
Contains public sector information licensed under the Open Government Licence v3.0.
"In banking "personal account" refers to one's account at the bank that is used for non-business purposes. Most likely, the service at the bank consists of one of two kinds of accounts or sometimes both: a savings account and a current account.
Banks differentiate their services for personal accounts from business accounts by setting lower minimum balance requirements, lower fees, free checks, free ATM usage, free debit card (Check card) usage, etc." [Personal account. Wikipedia]
The finance infographic sample "Personal current accounts timeline" was designed using ConceptDraw PRO software extended with Finanlial Infographics solution from Business Infographic area of ConceptDraw Solution Park.
Financial infogram
"A project plan, according to the Project Management Body of Knowledge, is: "...a formal, approved document used to guide both project execution and project control. The primary uses of the project plan are to document planning assumptions and decisions, facilitate communication among stakeholders, and document approved scope, cost, and schedule baselines. A project plan may be summarized or detailed." ...
The objective of a project plan is to define the approach to be used by the Project team to deliver the intended project management scope of the project.
At a minimum, a project plan answers basic questions about the project:
Why? - What is the problem or value proposition addressed by the project? Why is it being sponsored?
What? - What is the work that will be performed on the project? What are the major products/ deliverables?
Who? - Who will be involved and what will be their responsibilities within the project? How will they be organized?
When? - What is the project timeline and when will particularly meaningful points, referred to as milestones, be complete?" [Project plan. Wikipedia]
The timeline diagram example "New business project plan" was created using the ConceptDraw PRO diagramming and vector drawing software extended with the Timeline Diagrams solution from the Management area of ConceptDraw Solution Park.
The objective of a project plan is to define the approach to be used by the Project team to deliver the intended project management scope of the project.
At a minimum, a project plan answers basic questions about the project:
Why? - What is the problem or value proposition addressed by the project? Why is it being sponsored?
What? - What is the work that will be performed on the project? What are the major products/ deliverables?
Who? - Who will be involved and what will be their responsibilities within the project? How will they be organized?
When? - What is the project timeline and when will particularly meaningful points, referred to as milestones, be complete?" [Project plan. Wikipedia]
The timeline diagram example "New business project plan" was created using the ConceptDraw PRO diagramming and vector drawing software extended with the Timeline Diagrams solution from the Management area of ConceptDraw Solution Park.
Project timeline
Timeline charts presents events and time periods on a chronological scale. They are used in project management to visualize project milestones and upper level phases, and show project progress.
"Time is one of the most critical resources in any project. Good planning spreads the necessary work over a reasonable period of time. This allows everyone to work at a consistent, sustainable pace. Poor planning leaves people stuck and idle, then forces them to scramble to catch up later on. While it does take time to plan ahead, the time ... saved more than make up for it. Good planning is a part of good doing. ...
A Timeline is a clean and concise visual representation of a series of events. It helps you to arrange large chunks of time and see the overall plan easily." [education.rec.ri.cmu.edu/ previews/ nxt_ products/ robotics_ eng_ vol_ 2/ preview/ content/ timeline.pdf]
This timeline template for the ConceptDraw PRO diagramming and vector drawing software is included in the Timeline Diagrams solution from the Management area of ConceptDraw Solution Park.
Timeline template
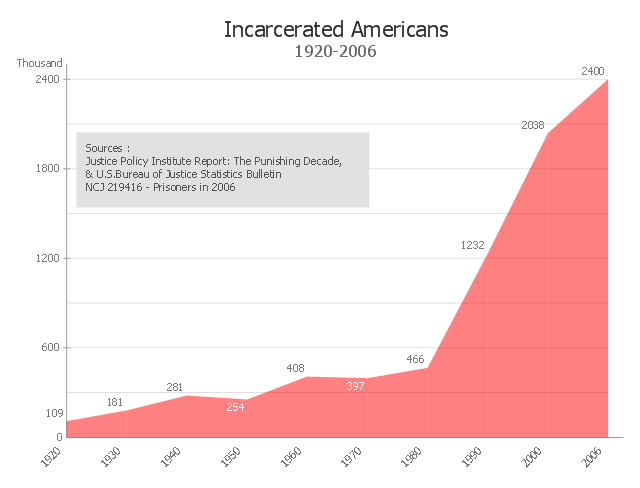
This area chart sample shows the timeline of total number of inmates in U.S. prisons, jails, and juvenile facilities from 1920 to 2006. It was redesigned from the Wikimedia Commons file: US incarceration timeline-clean.gif. [commons.wikimedia.org/ wiki/ File:US_ incarceration_ timeline-clean.gif]
"Incarceration in the United States of America is one of the main forms of punishment, rehabilitation, or both for the commission of felony and other offenses. The United States has the highest documented incarceration rate in the world. At year-end 2009, it was 743 adults incarcerated per 100,000 population.
According to the U.S. Bureau of Justice Statistics (BJS), 2,266,800 adults were incarcerated in U.S. federal and state prisons, and county jails at year-end 2011 – about 0.94% of adults in the U.S. resident population. Additionally, 4,814,200 adults at year-end 2011 were on probation or on parole. In total, 6,977,700 adults were under correctional supervision (probation, parole, jail, or prison) in 2011 – about 2.9% of adults in the U.S. resident population.
In addition, there were 70,792 juveniles in juvenile detention in 2010.
Although debtor's prisons no longer exist in the United States, residents of some U.S. states can still be incarcerated for debt as of 2014." [Incarceration in the United States. Wikipedia]
The area graph example "US incarceration timeline-clean" was created using the ConceptDraw PRO diagramming and vector drawing software extended with the Area Charts solution from the Graphs and Charts area of ConceptDraw Solution Park.
Area graph
- Business Process Mapping — How to Map a Work Process | How to ...
- CS Odessa Has Updated Timeline Diagrams Solution for ...
- Project Timeline | Timeline Diagrams | Timeline Examples | Visio ...
- Timeline Diagrams | Line Graphs | Basic Line Graphs | Time Line ...
- How to Create a Timeline Diagram | Project Timeline | How to Make ...
- Timeline Diagrams | Time Line Chart For Library Management System
- Timeline Examples | Project Timeline | Timeline Diagrams | Visio ...
- Timeline Diagrams | Fishbone Diagrams | Draw Timeline And ...
- Project Timeline | Timeline Examples | How to Make a Timeline ...
- Fishbone Diagrams | How Is A Timeline Graph Applied To Problem ...
- Timeline Examples | Project Timeline | How to Make a Timeline ...
- Timeline Chart In Software Engineering
- Project Timeline | How to Create a Timeline Diagram | Timeline ...
- Project Timeline | How to Make a Timeline | Timeline Diagrams ...
- Timeline Diagrams | Cafe and Restaurant Floor Plans | Business ...
- How to Create a Timeline Diagram in ConceptDraw PRO | Timeline ...
- ATM Sequence diagram | ATM UML Diagrams | Timeline Diagrams ...
- Project Timeline | Timeline Examples | Timeline Diagrams ...
- Timeline diagram | Project timeline diagram | Timeline Diagrams ...