This site uses cookies. By continuing to browse the ConceptDraw site you are agreeing to our Use of Site Cookies.

Bubble diagrams with ConceptDraw DIAGRAM

Using ConceptDraw you will be able to create bubble diagrams from the ready ConceptDraw library objects or make your own objects. The created diagram can be saved and edited, objects can be moved and links between them will be automatically repainted after object moving because of using the ConceptDraw connectors.

Mac Compatible Remote Presentation

Mac compatible remote presentation, A simple way to share your presentation remotely via Skype. All participants receive presentation file.

Bubble Chart

How to design a Bubble Chart? It’s very easy! All that you need is a powerful software. Never before creation of a Bubble Chart wasn’t so easy as now with tools of Bubble Diagrams Solution from the "Diagrams" Area for ConceptDraw Solution Park.
HelpDesk

How to Add a Bubble Diagram to PowerPoint Presentation

Bubble diagrams can be used to compare concepts and identify areas of similarity and difference. ConceptDraw DIAGRAM allows you to make an MS PowerPoint Presentation from your charts in a few simple steps. A bubble diagram is a chart that represents information visually in the form of a series of bubbles. Bubble charts are often used in marketing and management during the early stages of product development to visualize ideas and concepts by organizing them in a hierarchy. The ability to create this form of a diagram is contained within the Bubble Diagrams solution. A PowerPoint presentation of bubble diagrams can be used to demonstrate and identify areas of similarity and difference of featured business ideas and concepts.

How to Create Presentation of Your Project Gantt Chart

During the planning, discussing and execution of a project you may need to prepare a presentation using project views such as the Gantt Chart, Multiproject Dashboard or Resource Usage View. It’s easy do with ConceptDraw PROJECT!

draw bar chart, draw bar graph, draw column chart Bar Graphs

draw bar chart, draw bar graph, draw column chart
The Bar Graphs solution enhances ConceptDraw DIAGRAM functionality with templates, numerous professional-looking samples, and a library of vector stencils for drawing different types of Bar Graphs, such as Simple Bar Graph, Double Bar Graph, Divided Bar Graph, Horizontal Bar Graph, Vertical Bar Graph, and Column Bar Chart.

Simple Drawing Applications for Mac

ConceptDraw gives the ability to draw simple diagrams like flowcharts, block diagrams, bar charts, histograms, pie charts, divided bar diagrams, line graphs, area charts, scatter plots, circular arrows diagrams, Venn diagrams, bubble diagrams, concept maps, and others.
HelpDesk

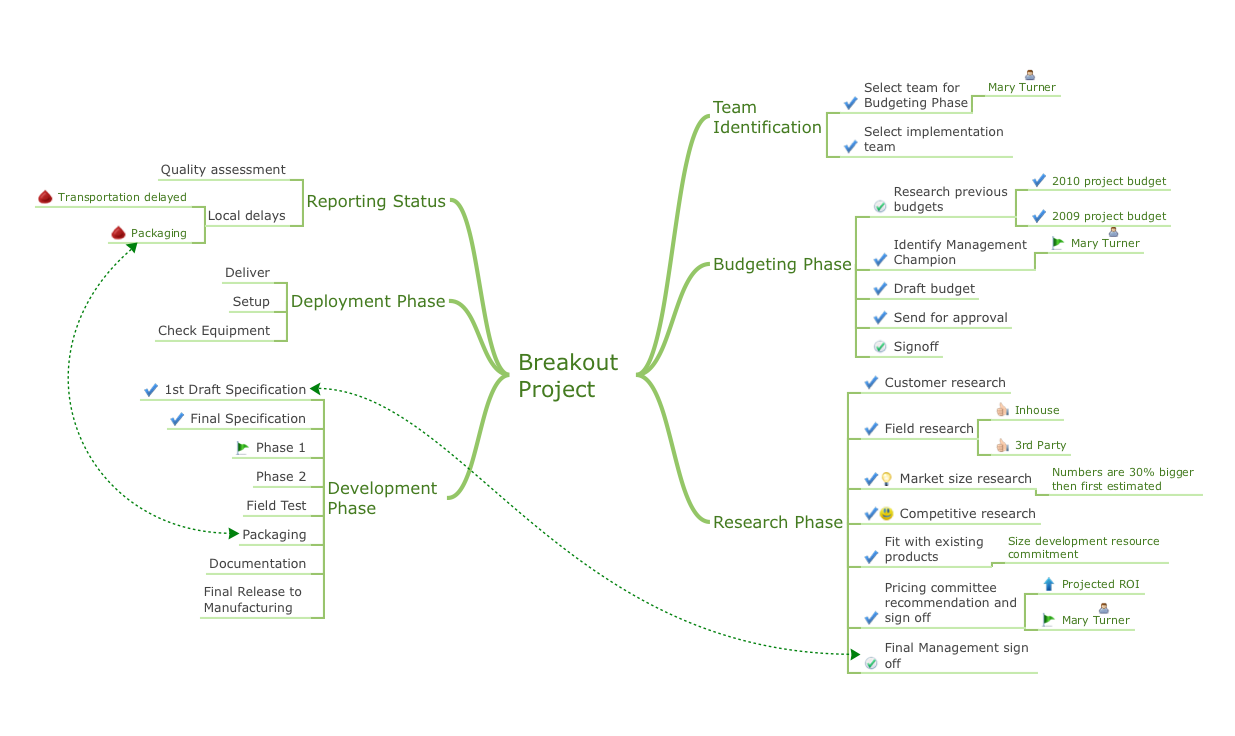
How to Present a Mind Map With Multiple Main Ideas

The simplest way to create a presentation from your map is by creating Default Presentation, but it will not display slides for additional Main Ideas and their topics. This article describes how you can do this.

Bubble Charts

Bubble Charts are convenient way to visualize ideas and concepts by organizing them in a hierarchy. To show the importance of ideas you can use different bubble sizes and colors. ConceptDraw DIAGRAM diagramming and vector drawing software extended with Bubble Diagrams Solution from the "Diagrams" Area affords you the easiest and fastest way for designing professional looking Bubble Charts.

Create a Presentation Using a Design Template

The intuitive interface of ConceptDraw MINDMAP and the Functional Tools overview below will guide you in creating and demonstrating powerful mind map presentations using template.
An advanced tool allows you effectively generate, change, and update your presentation.

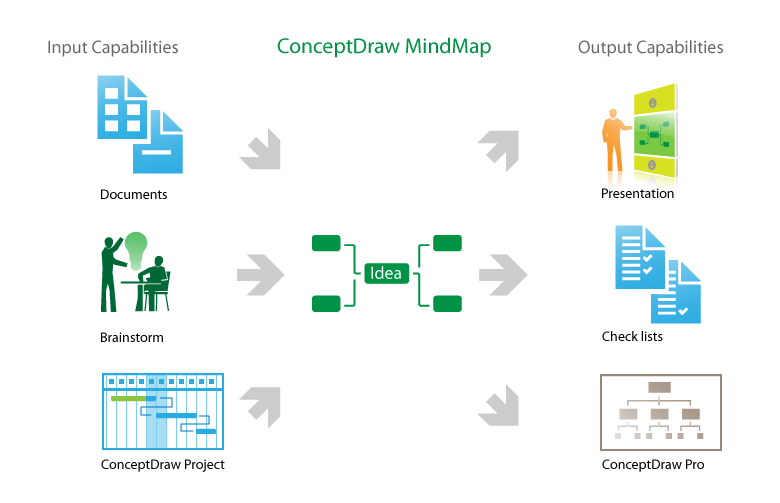
Best Software for Making Presentations

An advanced tool for creating presentations, if you decide to represent data without spending hours on that.

Basic Diagramming

Mathematical Drawing Software - Draw mathematical illustration diagrams easily from examples and templates!

Examples of Flowcharts, Org Charts and More

ConceptDraw examples covers a broad spectrum of business graphics categories. We separated all the graphic documents on application areas and had produced multiple solutions for each of them. ConceptDraw provides a wide variety of examples such as flowcharts, organizational charts, business charts, UML diagrams, database and ERD, directional map, network diagrams and lots more. Each solution accommodates 10+ examples that shows specific application cases of a diagram. ConceptDraw STORE is an application for downloading solutions with examples, templates and stencil libraries. Please choose any examples you are interested in, alternatively download them for free; you will need to install ConceptDraw to view them. As you will see, ConceptDraw is very powerful, you can use more than 10000 symbols, examples, and many pre-drawn templates, to create your own spectacular flowcharts, business diagrams, network diagrams and lots more, effortlessly, and in no time at all.
What is ConceptDraw OFFICE

Bubble Map Maker

The Bubble Map is a popular tool for visualization a data set which is widely used in economics, medicine, software engineering, architecture, and many other fields. Each bubble on the Bubble Map is characterized by coordinates, color and size. ConceptDraw DIAGRAM diagramming and vector drawing software extended with Bubble Diagrams Solution from the "Diagrams" Area is a powerful Bubble Map Maker.

How to do presentation of Mind Maps via Skype conference call?

Tools to do presentation of mindmaps via Skype.