Bubble diagrams with ConceptDraw DIAGRAM
Using ConceptDraw you will be able to create bubble diagrams from the ready ConceptDraw library objects or make your own objects. The created diagram can be saved and edited, objects can be moved and links between them will be automatically repainted after object moving because of using the ConceptDraw connectors.Bubble Charts
Bubble Charts are convenient way to visualize ideas and concepts by organizing them in a hierarchy. To show the importance of ideas you can use different bubble sizes and colors. ConceptDraw DIAGRAM diagramming and vector drawing software extended with Bubble Diagrams Solution from the "Diagrams" Area affords you the easiest and fastest way for designing professional looking Bubble Charts.HelpDesk
How to Create a Bubble Diagram
Bubble Diagram is a simple chart that consists of circles (bubbles) repesening certain topics or processes. Bubbles are connected by lines depicting the type of relationships between the bubbles. The size of each bubble is depended on the importance of the entity it represents. Bubble charts are widely used throughout social, economical, medical, and other scientific researches as well as throughout architecture and business management. Bubble charts are often used during the early stages of product development to visualize thoughts and ideas for the purpose of sketching out a development plan. ConceptDraw DIAGRAM allows you to draw a bubble diagrams using the Bubble Diagrams solution.Idea Outline
The Idea Communication Solution helps to brainstorm new idea, draw new idea mind map, outline new idea, show new idea at the presentation, and report new idea at the meeting.How To Create a Bubble Chart
Bubble diagrams solution extends ConceptDraw DIAGRAM software with templates, Using ConceptDraw Connectors, you can create a bubble chart in moments.Using ConceptDraw you will be able to create a bubble chart from the ready ConceptDraw library objects or make your own objects. The created diagram can represent ideas organization, in brainstorming processes, by teachers for explaining difficult ideas or for presentations.
Bubble Chart
How to design a Bubble Chart? It’s very easy! All that you need is a powerful software. Never before creation of a Bubble Chart wasn’t so easy as now with tools of Bubble Diagrams Solution from the "Diagrams" Area for ConceptDraw Solution Park.
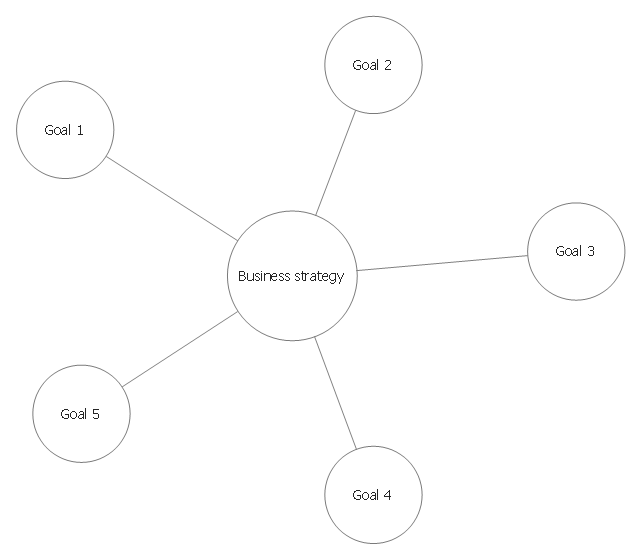
Bubble diagrams (bubble maps, bubble charts, spray diagrams) visualize the ideas or concepts organized in hierarchy often with one level below the central idea.
To show the importance of ideas use the bubbles of different sizes.
To compare two ideas and show the common and different sub-ideas use bubble diagrams with two central ideas.
They are used for business illustrations, presentations, planning, design, strategy development.
The bubble diagram template for the ConceptDraw DIAGRAM diagramming and vector drawing software is included in Business Diagrams solution from Management area of ConceptDraw Solution Park.
HelpDesk
How to Add a Bubble Diagram to PowerPoint Presentation
Bubble diagrams can be used to compare concepts and identify areas of similarity and difference. ConceptDraw DIAGRAM allows you to make an MS PowerPoint Presentation from your charts in a few simple steps. A bubble diagram is a chart that represents information visually in the form of a series of bubbles. Bubble charts are often used in marketing and management during the early stages of product development to visualize ideas and concepts by organizing them in a hierarchy. The ability to create this form of a diagram is contained within the Bubble Diagrams solution. A PowerPoint presentation of bubble diagrams can be used to demonstrate and identify areas of similarity and difference of featured business ideas and concepts.Bubble diagrams in Landscape Design with ConceptDraw DIAGRAM
To define the links between the different areas of your own landscape design and see the project from aside, we recommend to draw landscape diagram called bubble one which is analogue of «mind maps» as it allows us to create approximate image of our future proper landscape view. Use special libraries (and we have plenty of them) with objects of landscape design to be able to create the detailed plan of your landscape which will be looking so smart and professionally good as the samples we provide were created by designers who know so much about making such kinds of design plans. Having ConceptDraw DIAGRAM as the assistant in your work, will ensure the success after using our product. Make the bubble diagrams as well as any other ones in minutes with ease having our application called ConceptDraw DIAGRAM and you will see how quick it will change your life simplifying lots of work.How to Draw a Bubble Chart
Video tutorials on ConceptDraw products. Try it today!Bubble Chart Maker
ConceptDraw DIAGRAM diagramming and vector drawing software extended with Bubble Diagrams Solution from the "Diagrams" Area is a powerful Bubble Chart Maker.Best Multi-Platform Diagram Software
ConceptDraw DIAGRAM is a powerful tool for drawing business communication ideas and concepts, simple visual presentation of numerical data in the Mac environment.Mac Compatible Remote Presentation
Mac compatible remote presentation, A simple way to share your presentation remotely via Skype. All participants receive presentation file.HelpDesk
How to Add a Bubble Diagram to MS Word
A bubble diagram is used the same purpose as a scatter diagram, but in the case, if the data has three dimensions, each of that containing the set of values. A bubble chart is a diagram in which the data points are replaced with bubbles, and the size of the bubbles represents some additional dimension of the data. A bubble chart does not have the axis. The sizes of the bubbles are determined by the values in the third dimension. Any additional information about the entities beyond their three primary dimensions can be depicted by rendering bubbles in colors and patterns that are selected in a certain way. The legend containing the further information can be added to a bubble diagram. ConceptDraw DIAGRAM allows you to easily create various business management and marketing charts, including bubble diagrams and then add them to an MS Word document.Simple Drawing Applications for Mac
ConceptDraw gives the ability to draw simple diagrams like flowcharts, block diagrams, bar charts, histograms, pie charts, divided bar diagrams, line graphs, area charts, scatter plots, circular arrows diagrams, Venn diagrams, bubble diagrams, concept maps, and others.HelpDesk
How To Create Visio Bubble Chart
ConceptDraw DIAGRAM allows you to easily create business charts and diagrams of any complexity, including the bubbles diagram and then make an MS Visio file from your diagram in a few simple steps.HelpDesk
How To Convert a Bubble Diagram to Adobe PDF
ConceptDraw DIAGRAM allows you to easily share your business documentation between different computers with different operating systems and applications using its export capabilities. You can get your bubble diagrams in pdf format and freely communicate them with others.Best Diagramming Software for macOS
ConceptDraw DIAGRAM creates drawings, flowcharts, block diagrams, bar charts, histograms, pie charts, divided bar diagrams, line graphs, area charts, scatter plots, circular arrows diagrams, Venn diagrams, bubble diagrams with great visual appeal on Mac OS X.Food Pictures
One of the key roles at the attracting visitors in catering establishments of different formats plays their visual solution, design of advertising elements of fast foods and restaurants.ConceptDraw DIAGRAM software enhanced with unique Food Court solution from the Food and Beverage area of ConceptDraw Solution Park allows to design inviting and attractive signboards, pictorial menus with appetizing food pictures.
Database Design
ConceptDraw DIAGRAM extended with IDEF Business Process Diagrams solution from the Business Processes area of ConceptDraw Solution Park is an ideal software for effective database design and drawing IDEF diagrams visually representing all steps of database design process.- Bubble diagrams with ConceptDraw DIAGRAM | Bubble Chart | How ...
- Bubble Diagrams | Best Multi-Platform Diagram Software | Idea ...
- The Best Mac Software for Diagramming or Drawing | Bubble ...
- Bubble Chart
- How To Create a Bubble Chart | Best Diagramming Software for ...
- Bubble Charts | How To Create a Bubble Chart | Bubble Map Maker ...
- Office Layout Plans | Bubble diagrams in Landscape Design with ...
- How To Create Visio Bubble Chart
- Bubble Charts | Marketing Charts | Bubble Chart | Mckinsey Charts
- ConceptDraw Arrows10 Technology | Bubble Diagrams | Bubble ...
- Bubble Chart Maker | Bubble Charts | Bubble Chart | Brainstorm ...
- Bubble diagrams with ConceptDraw DIAGRAM | Basic Diagramming ...
- Concept Map | Simple Diagramming | Bubble diagrams with ...
- How to Draw a Floor Plan for SPA | Spa Floor Plan | Bubble ...
- How to Operate a Multiple Main Idea on Your Mind Map | How to ...
- Best Diagramming Software for macOS | Bubble diagrams with ...
- How To Create a Bubble Chart | Bubble diagrams with ...
- Bubble Diagrams | Bubble Chart | Bubble diagrams in Landscape ...
- Bubble Chart Maker | Bubble Diagrams | Bubble Chart | Free Blank ...
- Database Design | How To Create a Bubble Chart | Electrical ...
- ERD | Entity Relationship Diagrams, ERD Software for Mac and Win
- Flowchart | Basic Flowchart Symbols and Meaning
- Flowchart | Flowchart Design - Symbols, Shapes, Stencils and Icons
- Flowchart | Flow Chart Symbols
- Electrical | Electrical Drawing - Wiring and Circuits Schematics
- Flowchart | Common Flowchart Symbols