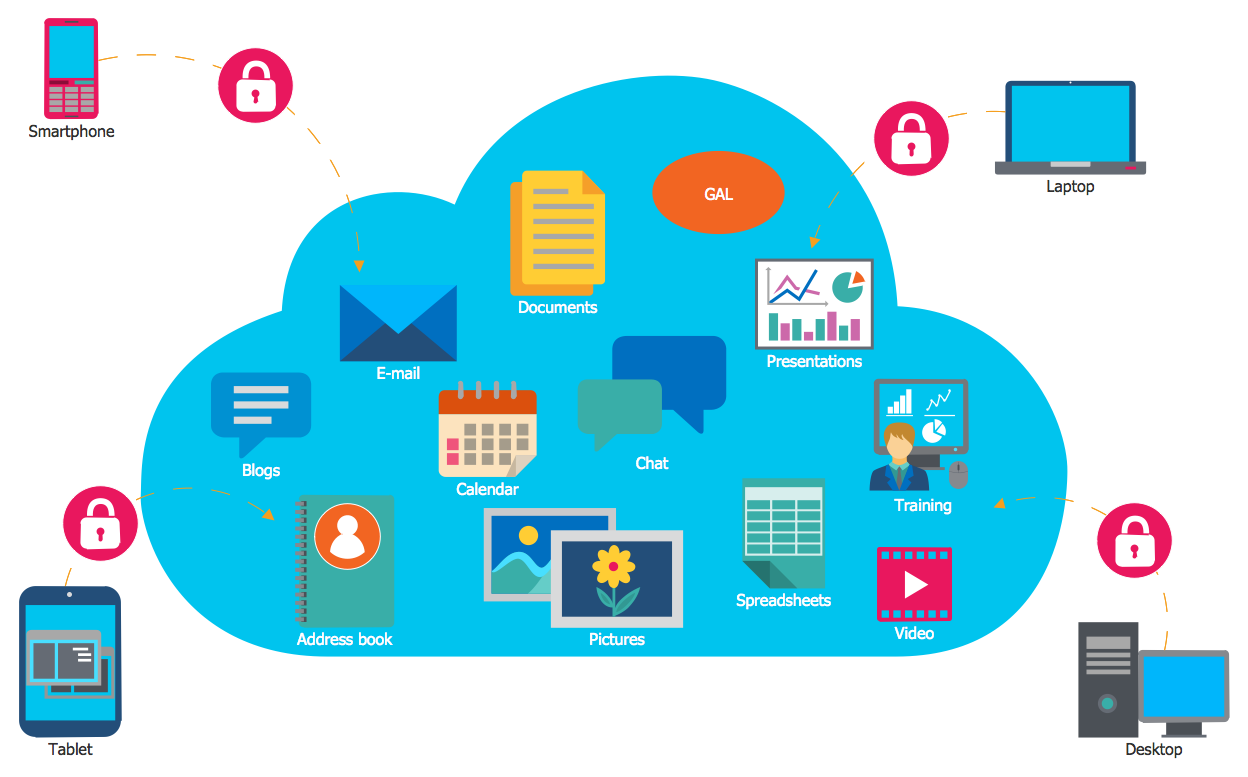
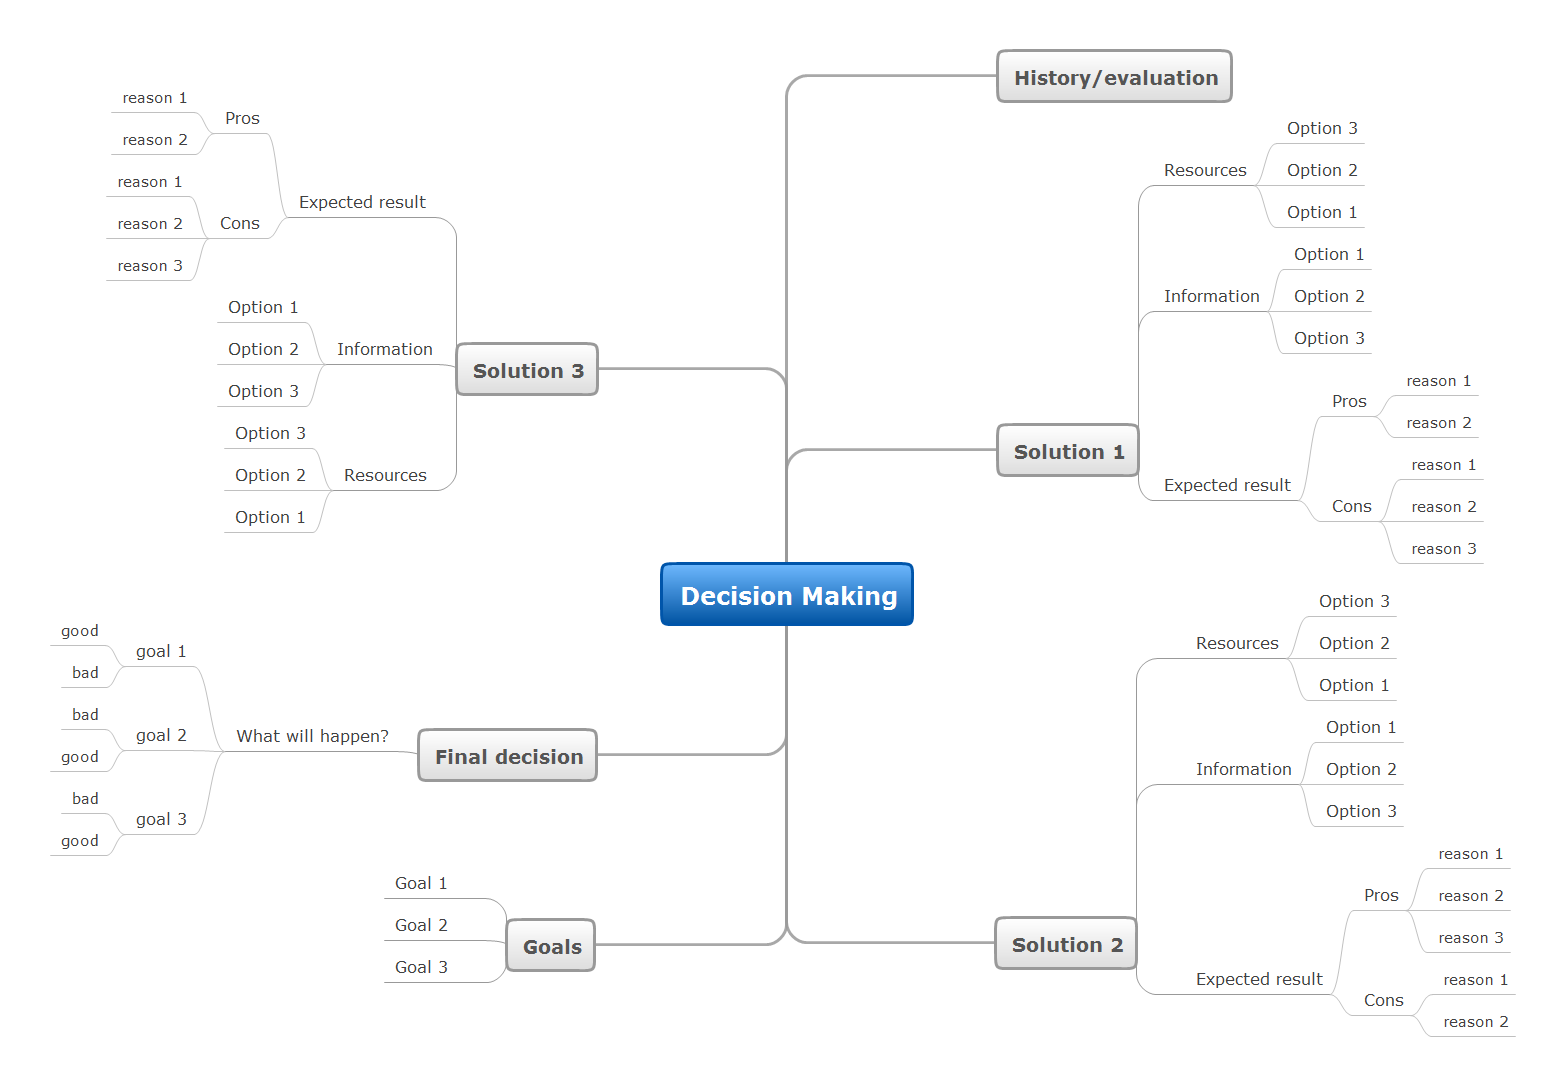
Made with
ConceptDraw
MINDMAP 16

Idea Outline

Universal Diagramming

Here lots tools for situational use for basic drawings, charts, geo-maps, building plans, wiring and computer network communications education, engineering and software diagramming graphics.

Idea Communication

Objective

Communicate new ideas and concepts visually as mindmaps.

Solution Purpose

Create new idea mind maps fast and easy.

Intended For

Intended for everyone who need to communicate new ideas and concepts visually.

Benefits

The Idea Communication Solution helps to brainstorm new idea, draw new idea mind map, outline new idea, show new idea at the presentation, and report new idea at the meeting.

Products and Methods

In the background of the solution you use ConceptDraw MINDMAP for brainstorming, mindmapping, outlining, presentation show, and meeting preparation and holding.

Idea Outline

Create MS Word document from your idea map.Double click the icon to open the MS Word document.The document is created automatically from the content of the active page of your map. The Main Idea became a document’s header. The document reflects the structure of the map (the hierarchy of topics) by different font style. Hyperlinks and Notes from your map are also converted within your MS Word document.

Idea Outline *

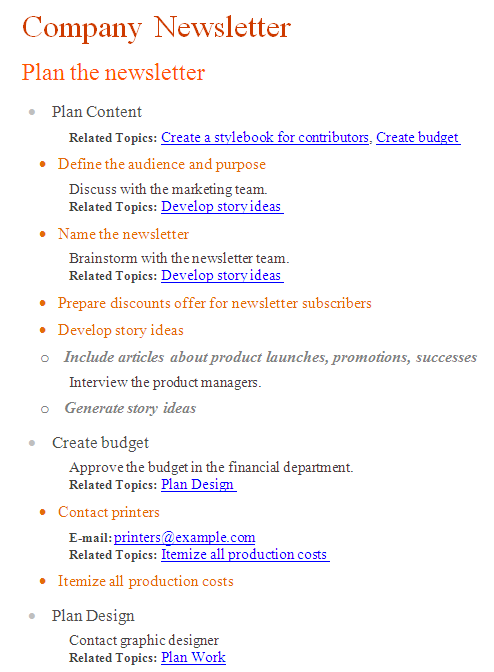
Example 1. Idea Outline


The Benefits for ConceptDraw MINDMAP Brainstorming Software

  • ConceptDraw MINDMAP is effective for brainstorming, designing mind maps, idea generating, creative and lateral thinking, creativity and problem solving.
  • ConceptDraw MINDMAP is ideal for team and personal work in Business, Marketing and Project Management.
  • The libraries with large quantity of vector objects help to illustrate your mind maps and to make them bright, visual and comprehensible.
  • Use of View Navigator tool lets create presentations from a mind map: you can simply select the map parts you want to present, sequence your slides, and preview the presentation.
  • ConceptDraw MINDMAP provides wide capabilities of importing and exporting in various formats: Microsoft PowerPoint, Microsoft Word, MS Excel, Mindjet MindManager, image, HTML, PDF file.


TEN RELATED HOW TO's:
Easy charting software comes with beautiful chart templates and examples. This makes it easy to create professional charts without prior experience.Chart Examples *
Picture: Chart Examples
Related Solutions:
Interactive tool helps you find the appropriate response to social media mentions quickly.How to Use the ″Online Store PR Campaign″ Sample *
Picture: How to Use the ″Online Store PR Campaign″ Sample
Related Solution:
Identify and Structure Factors. Use the Affinity Diagram to collect and structure factors that impact on a problem. ConceptDraw OFFICE suite is a software for identify and structure factors with affinity diagram. This is a grouping and structuring of factors that impact on a problem.PROBLEM ANALYSIS. <br>Identify and Structure Factors *
Picture: PROBLEM ANALYSIS. Identify and Structure Factors
Collaboration tool for project management enables you to give a new role to knowledge management and document sharing within your team.How To Use Collaboration Tool in Project Management *
Picture: How To Use Collaboration Tool in Project Management
Related Solution:
The Critical Path Method (CPM) is an algorithm for scheduling a set of project activities. It is an important tool for effective project management. ConceptDraw PROJECT implements this method to provide the user with a wide set of project management tools.Critical Path Method in ConceptDraw PROJECT *
Picture: Critical Path Method in ConceptDraw PROJECT
Related Solution:
When you need a drawing software to create a professional looking cross-functional charts, ConceptDraw with its Arrows10 Technology - is more than enough versatility to draw any type of diagram with any degree of complexity. Use templates with process maps, diagrams, charts to get the drawing in minutes.Cross-Functional Process Map Template *
Picture: Cross-Functional Process Map Template
SWOT analysis is an effective method of business planning, the question is how to do it. The most obvious way is to make a SWOT analysis in a Word document, which is not very convenient. Luckily, you can use software like ConceptDraw DIAGRAM that has features and templates made especially for SWOT analyzing. A SWOT Analysis is a manager's means of the strategic planning. It is used to define and classify considerable internal moments (strengths and weaknesses) and external forces (opportunities and threats) a business faces. You can use ConceptDraw MINDMAP to determine and organize factors utilized for SWOT analysis, and represent them in the SWOT matrix using ConceptDraw DIAGRAM. Using mind maps empowers you to explore and rank a lot of data engaged for SWOT analysis as well as recognize the relations between various pieces of information.How to Make SWOT Analysis in a Word Document *
Picture: How to Make SWOT Analysis in a Word Document
Related Solution:
Mind map template of a strategy map that can help you display a variety of performance measures that can have an impact on your organization.Strategy Map *
Picture: Strategy Map
Related Solution:
When thinking about data visualization, one of the first tools that comes to mind is a flowchart design. You can find flowchart symbols, shapes, stencils and icons easily on the Internet, but it might take time to systematize this information. Nevertheless, once you start flowcharting, you’ll love its simplicity and efficiency. This diagram consists from standard flowchart symbols, approved by ANSI (American National Standard Institute) for drawing flowcharts. A flowchart is a diagram that represents a step-by-step algorithm of any process, displaying the process stages as boxes that are connected with arrows. Flowchart design makes it clear and readable. Flowchart designed using ConceptDraw DIAGRAM flowchart software allows to make attractive and clear process presentation, it makes interpretation of the business process flow fresh and versatile. Great flowchart design view is a big advantage over the diagram created manually on a paper.Comparison of bad and good flowchart design showing zigzag flow, crossed connectors, and aligned elements
Picture: Flowchart Design: Principles, Layout, Symbols and Best Practices
Related Solution:
This sample was created in ConceptDraw DIAGRAM drawing software using the Flowcharts solution.Horizontal Flowchart
Picture: Horizontal Flowchart
Related Solution:
ConceptDraw
MINDMAP 16