Total Quality Management
QualityIn Solutions from Quality Management Area we support quality and manufacturing managers with visualization tools for production quality control and improvement. The solutions from Quality Management Area extend ConceptDraw DIAGRAM software with Quality Diagrams. Quality mind mapsThis solution extends ConceptDraw MINDMAP software with Quality Management Mind Maps (Presentations, Meeting Agendas, Problem to be solved). |
This mind map demonstrates how the well-known Total Quality Management (TQM) methodology can be presented in a mind map. Using mind mapping for quality management is a creative approach that allows one to structure all key quality points on the one page.

Example 1. Total Quality Management
Export to Outline
TQM
-
Customer orientation
- external customers
- internal customers
- supplier management
-
Leadership
- senior management commitment
- facilitating managerial role
- recognition of success
-
Empowerment
- involvement in quality improvement
- quality on the line
- process ownership
-
Continuous improvement
- problem solving approach
- training and education
- process management
-
Elimination of waste
- error visibility
- error prevention & TPM
- zero defections
-
Quality measurement
- cost of quality
- SPC
- benchmarking
- measurement of customer satisfaction
The Benefits for ConceptDraw MINDMAP Brainstorming Software
- ConceptDraw MINDMAP is effective for brainstorming, designing mind maps, idea generating, creative and lateral thinking, creativity and problem solving.
- ConceptDraw MINDMAP is ideal for team and personal work in Business, Marketing and Project Management.
- The libraries with large quantity of vector objects help to illustrate your mind maps and to make them bright, visual and comprehensible.
- Use of View Navigator tool lets create presentations from a mind map: you can simply select the map parts you want to present, sequence your slides, and preview the presentation.
- ConceptDraw MINDMAP provides wide capabilities of importing and exporting in various formats: Microsoft PowerPoint, Microsoft Word, MS Excel, Mindjet MindManager, image, HTML, PDF file.
TEN RELATED HOW TO's:
ConceptDraw DIAGRAM extended with IDEF0 Diagrams solution from the Software Development area of ConceptDraw Solution Park is a powerful diagramming and vector drawing IDEF0 software. All IDEF0 diagrams created in ConceptDraw DIAGRAM are vector graphic documents and can be reviewed, modified and converted to MS Visio XML format. To obtain the IDEF0 Visio documents from ConceptDraw DIAGRAM documents use the wide export possibilities of ConceptDraw DIAGRAM.
Picture: IDEF0 Visio
Related Solution:
ConceptDraw DIAGRAM charting and vector drawing software offers the Circle Spoke Diagram Template included to the Business Diagrams Solution from the Management Area. The use of ready template is the easiest way of drawing professional-looking Circle-Spoke Diagrams.
Picture: Circle Spoke Diagram Template
Related Solution:
This sample shows the Flowchart that displays the process of the achievement the consensus, in other words solving for the acceptable solution.
This Flowchart has start point. The rectangles on it represent the steps of the process and are connected with arrows that show the sequence of the actions. The diamonds with yes/no shows the decisions. The Flowcharts are widely used in marketing, business, analytics, government, politics, engineering, architecture, science, manufacturing, administration, etc.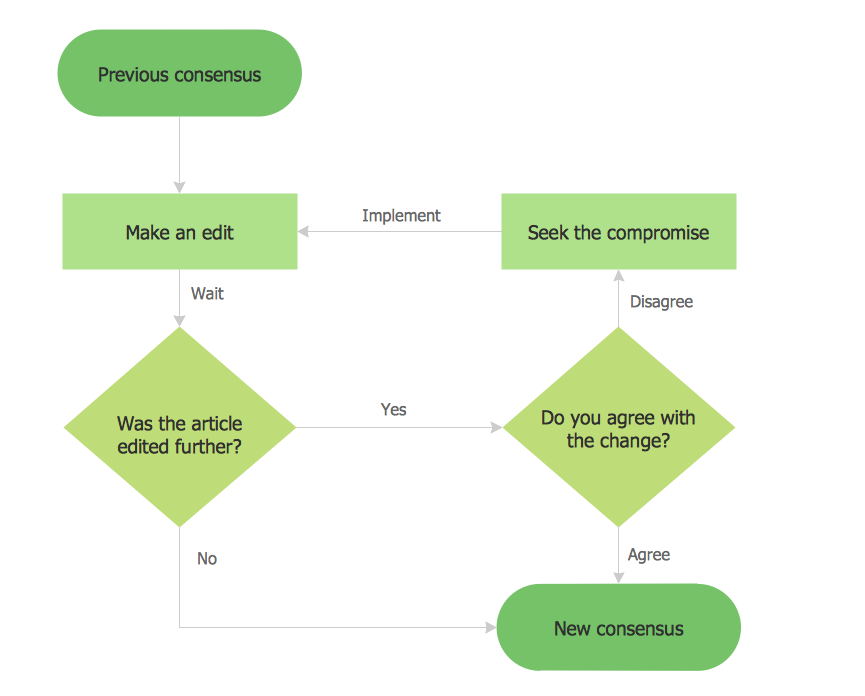
Picture: Example Basic Flowchart. Flowchart Examples
Related Solution:
ConceptDraw MINDMAP is the most productive tool you can use to solve problems and generate yout great ideas.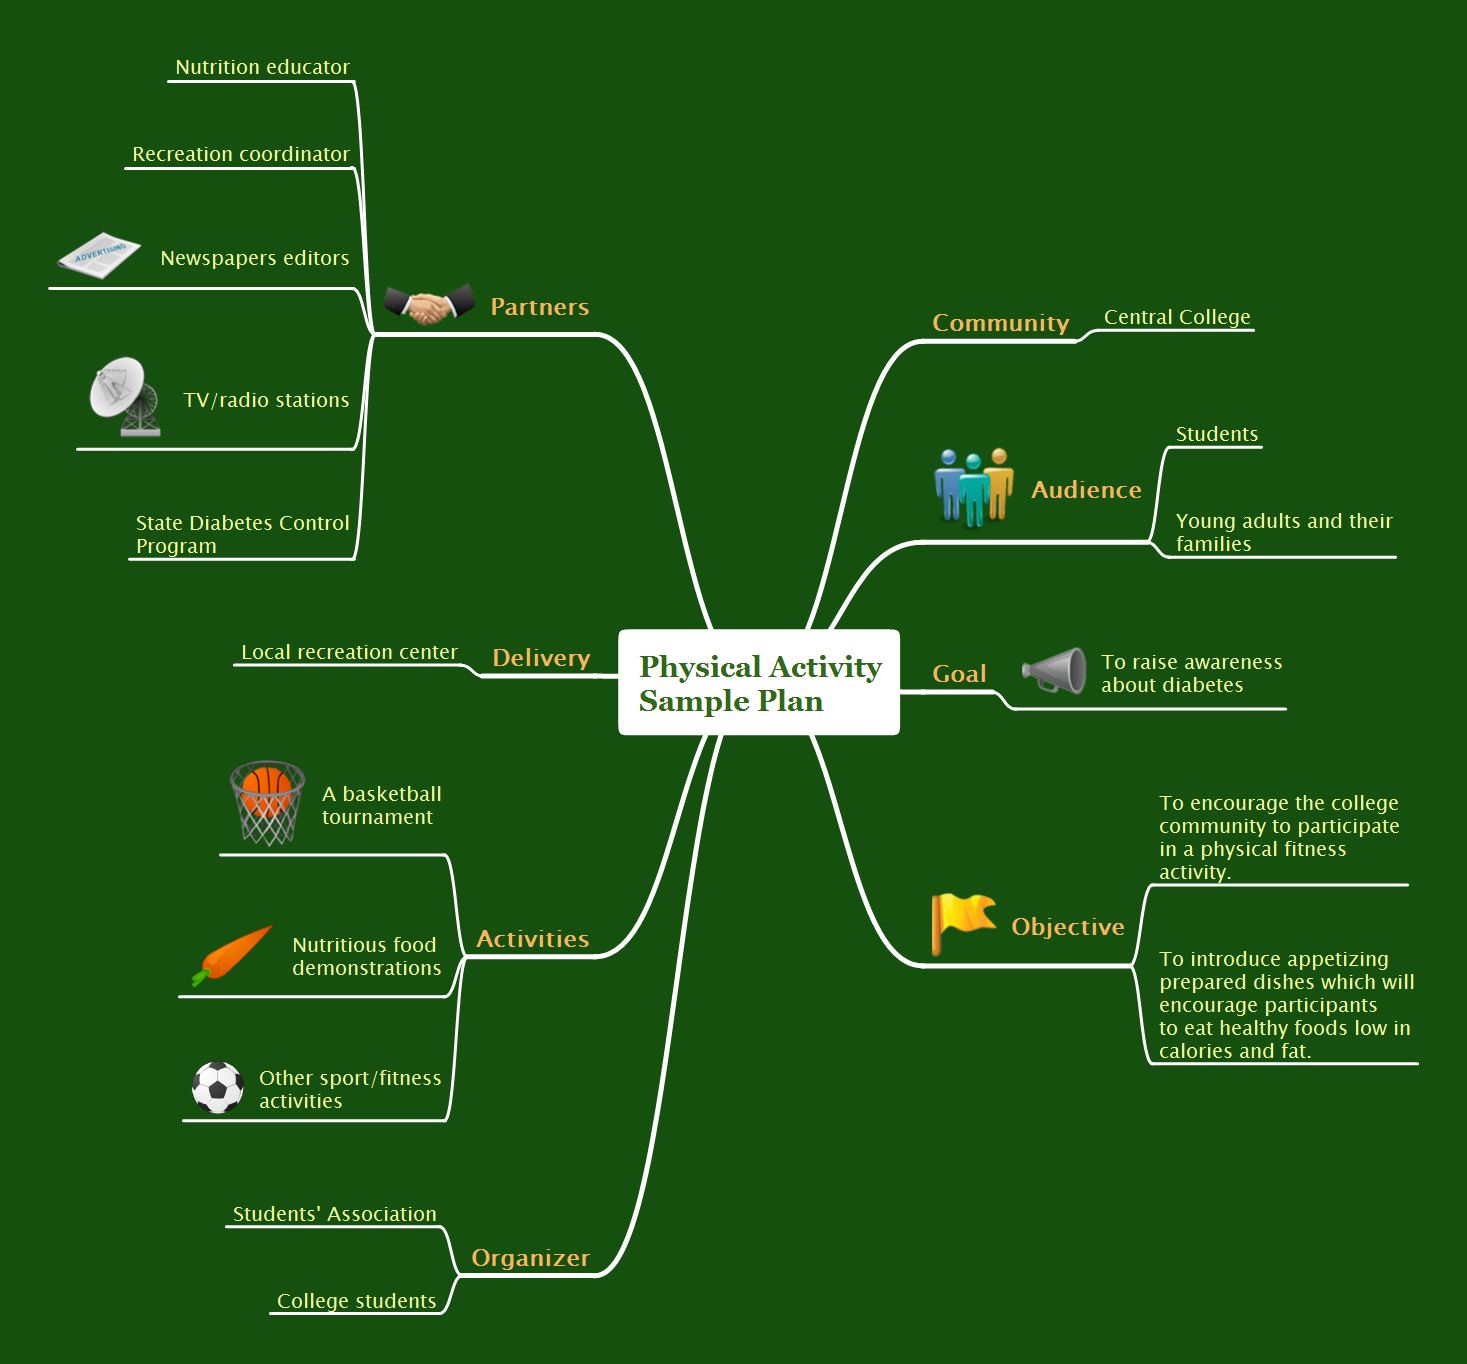
Picture: Professional & Powerful Mind Mapping Software
Related Solution:
A software tool that saves your time on making decisions now has the ability to make decisions with remote team via Skype.
Picture: Decision Making Software For Small Business
Related Solution:
This action mindmap helps respond to feature suggestions made by customers or enhancement requirements related to must-have features. The example contains ready to use response phrases organized into mindmap for quick composing and tweeting/posting of the response messages.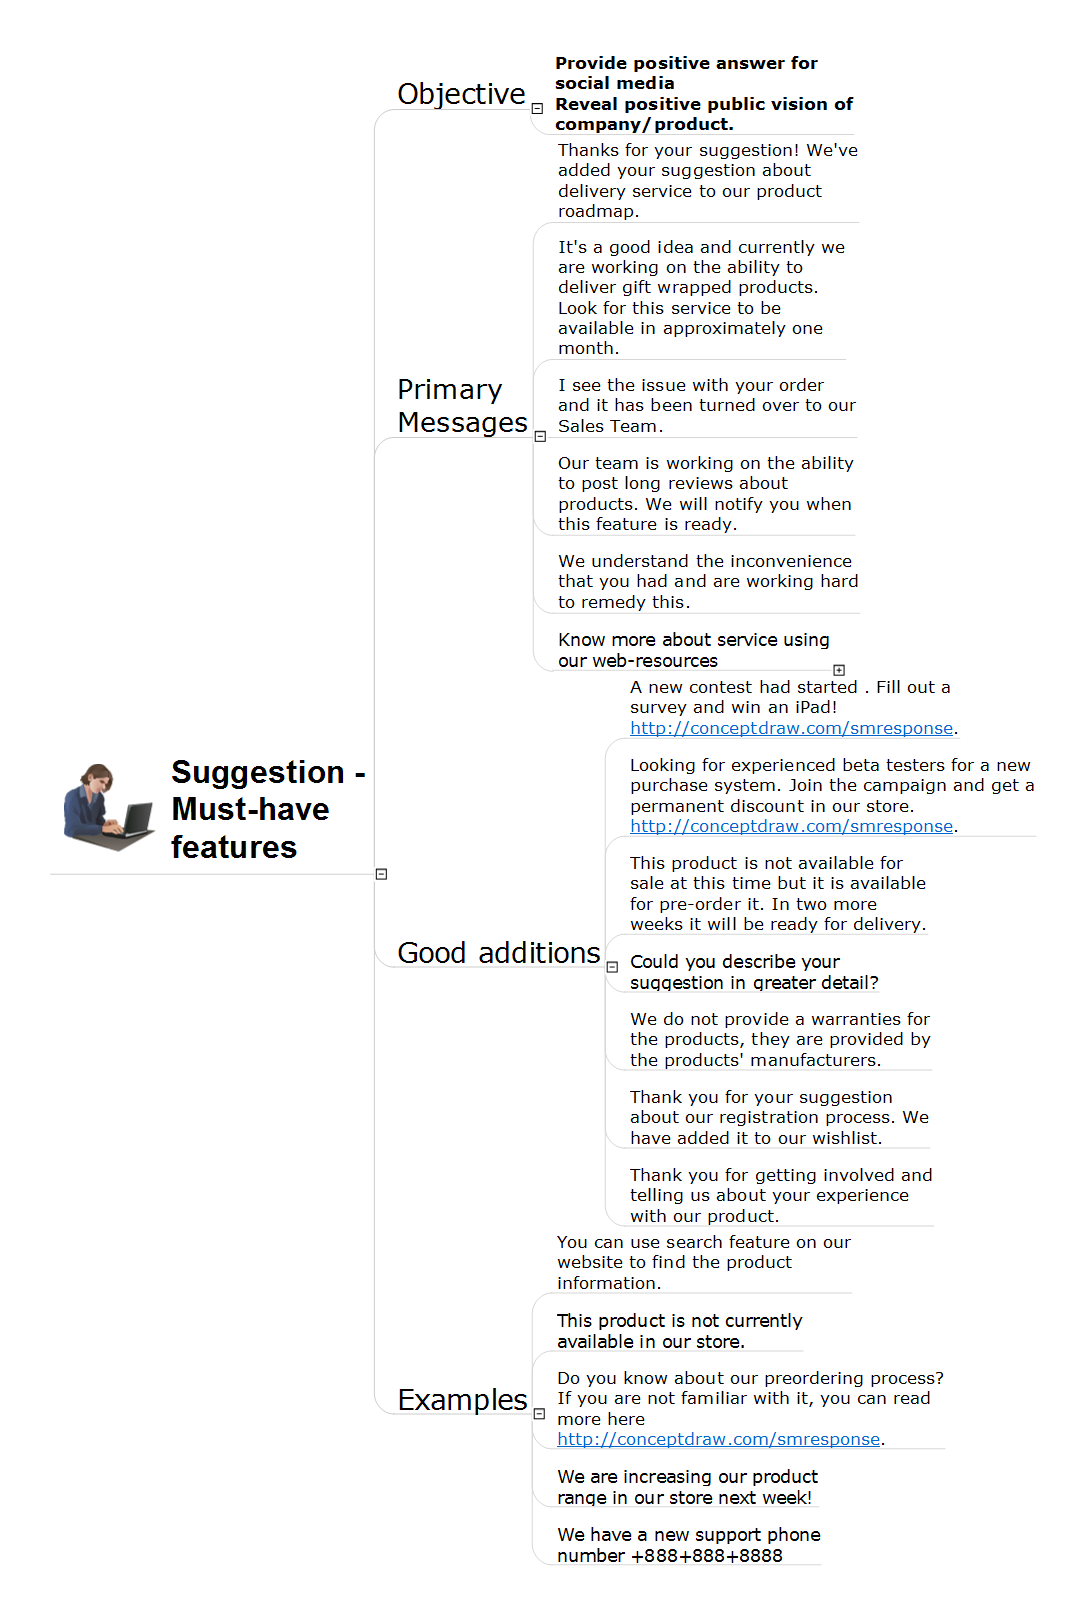
Picture: Must Have Suggestion
Related Solution:
Sharing Documents Trough Skype: Share files, manage projects, inspire ideas, connect people.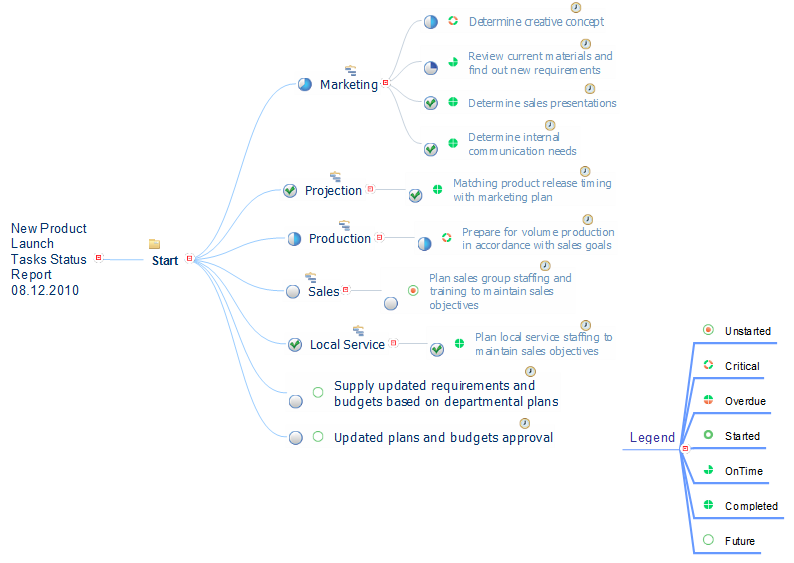
Picture: How to Use Skype for Sharing Documents
Related Solution:
A basic mind map that organizes the data of a product proposal.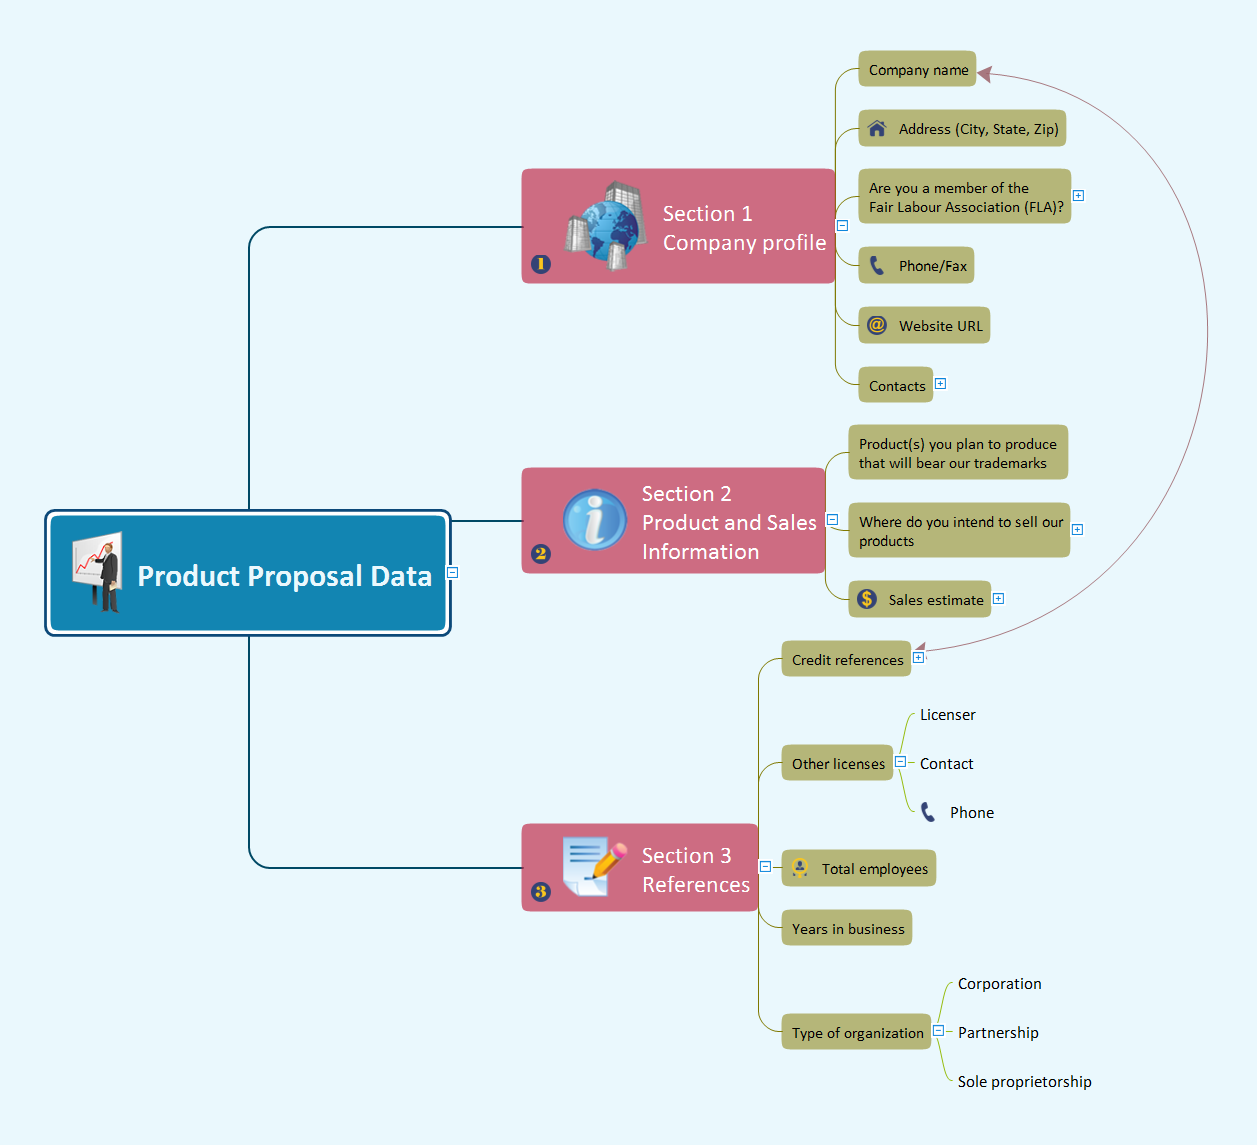
Picture: Product Proposal Data
Related Solution:
To support you in your tasks you can use the power of ConceptDraw DIAGRAM providing
intelligent vector graphics that are useful for management diagramming and
ConceptDraw MINDMAP for key management mind maps.
Picture: Business Productivity - Management
Related Solution:
This mind map is a template you can fill in in case when you have a problem to be solved. Filling in all fields gives you a solid vision good overview of the problem, making the decision , so then a decision becomes easier to find.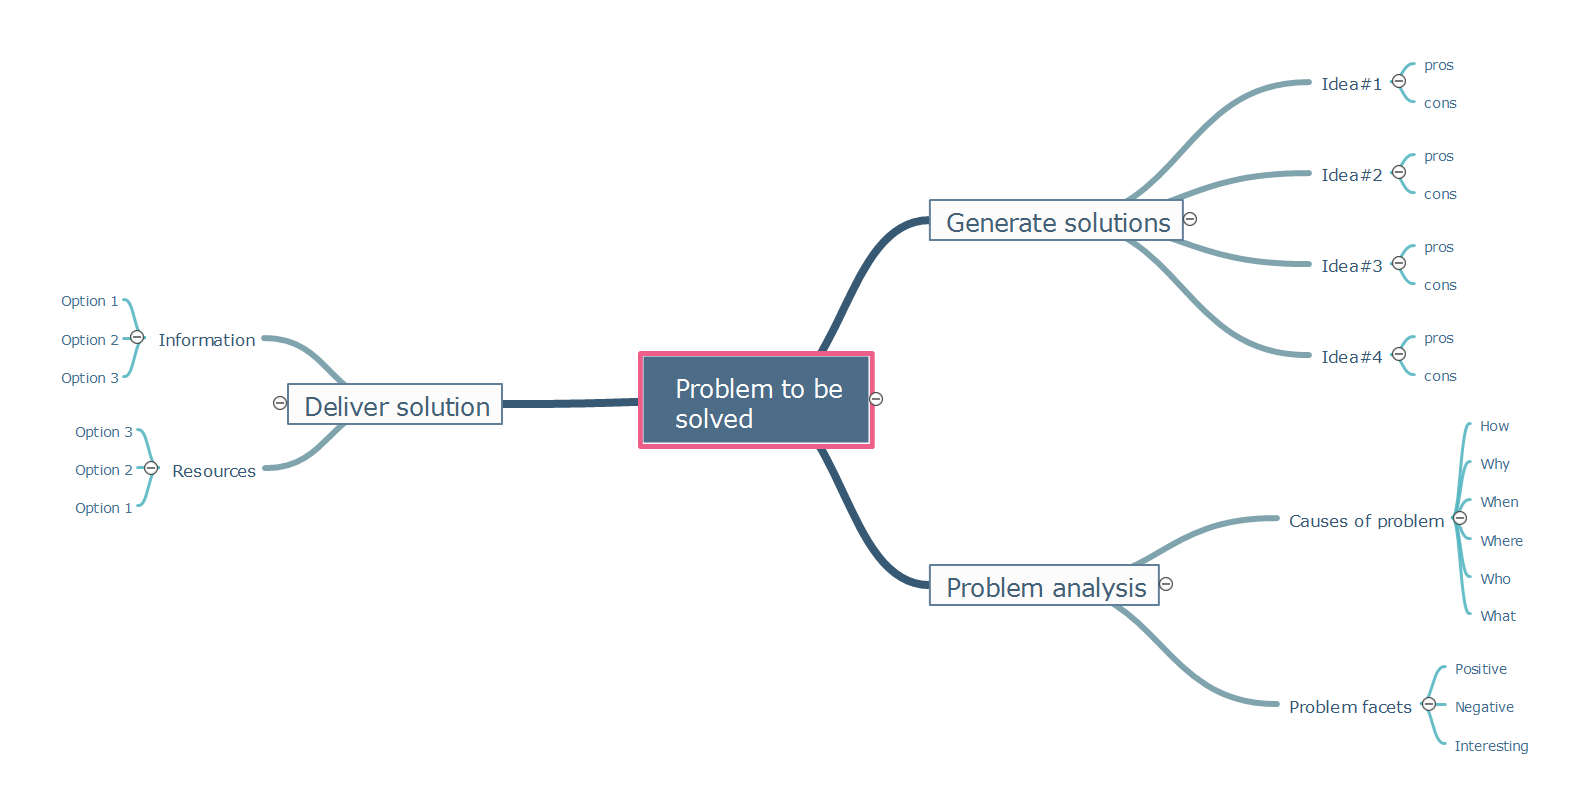
Picture: Problem to be solved
Related Solution:
ConceptDraw
MINDMAP 16