This site uses cookies. By continuing to browse the ConceptDraw site you are agreeing to our Use of Site Cookies.

Database Design

ConceptDraw DIAGRAM extended with IDEF Business Process Diagrams solution from the Business Processes area of ConceptDraw Solution Park is an ideal software for effective database design and drawing IDEF diagrams visually representing all steps of database design process.

How To Create a Bubble Chart
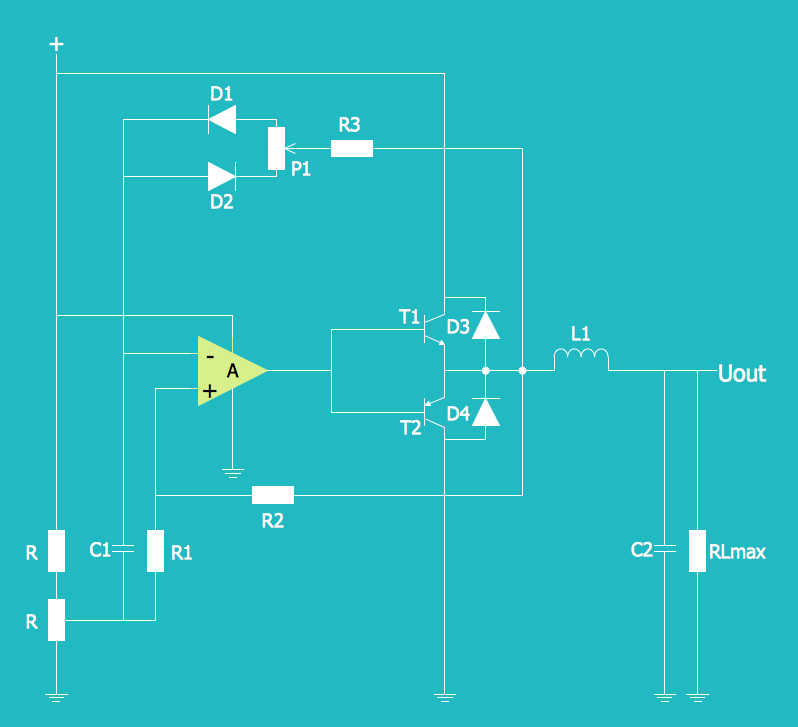
Bubble diagrams solution extends ConceptDraw DIAGRAM software with templates, Using ConceptDraw Connectors, you can create a bubble chart in moments.
Using ConceptDraw you will be able to create a bubble chart from the ready ConceptDraw library objects or make your own objects. The created diagram can represent ideas organization, in brainstorming processes, by teachers for explaining difficult ideas or for presentations.

Electrical Diagram

Electrical Diagram is a visual graphical representation of an electrical circuit. ConceptDraw DIAGRAM diagramming and vector drawing software supplied with unique Electrical Engineering Solution from the Industrial Engineering Area will help you design Electrical Diagram of any complexity without efforts.

Bubble diagrams with ConceptDraw DIAGRAM

Using ConceptDraw you will be able to create bubble diagrams from the ready ConceptDraw library objects or make your own objects. The created diagram can be saved and edited, objects can be moved and links between them will be automatically repainted after object moving because of using the ConceptDraw connectors.

bubble chart, bubble chart creator, bubble diagram Bubble Diagrams

bubble chart, bubble chart creator, bubble diagram
Bubble diagrams have enjoyed great success in software engineering, architecture, economics, medicine, landscape design, scientific and educational process, for ideas organization during brainstorming, for making business illustrations, presentations, planning, design, and strategy development. They are popular because of their simplicity and their powerful visual communication attributes.

How To Make a Bubble Chart

Bubble diagrams solution extends ConceptDraw DIAGRAM software with templates, Using ConceptDraw Connectors, you can make a bubble chart in moments. Using ConceptDraw you will be able to make a bubble chart from the ready ConceptDraw library objects or make your own objects. The created diagram can represent ideas organization, in brainstorming processes, by teachers for explaining difficult ideas or for presentations.

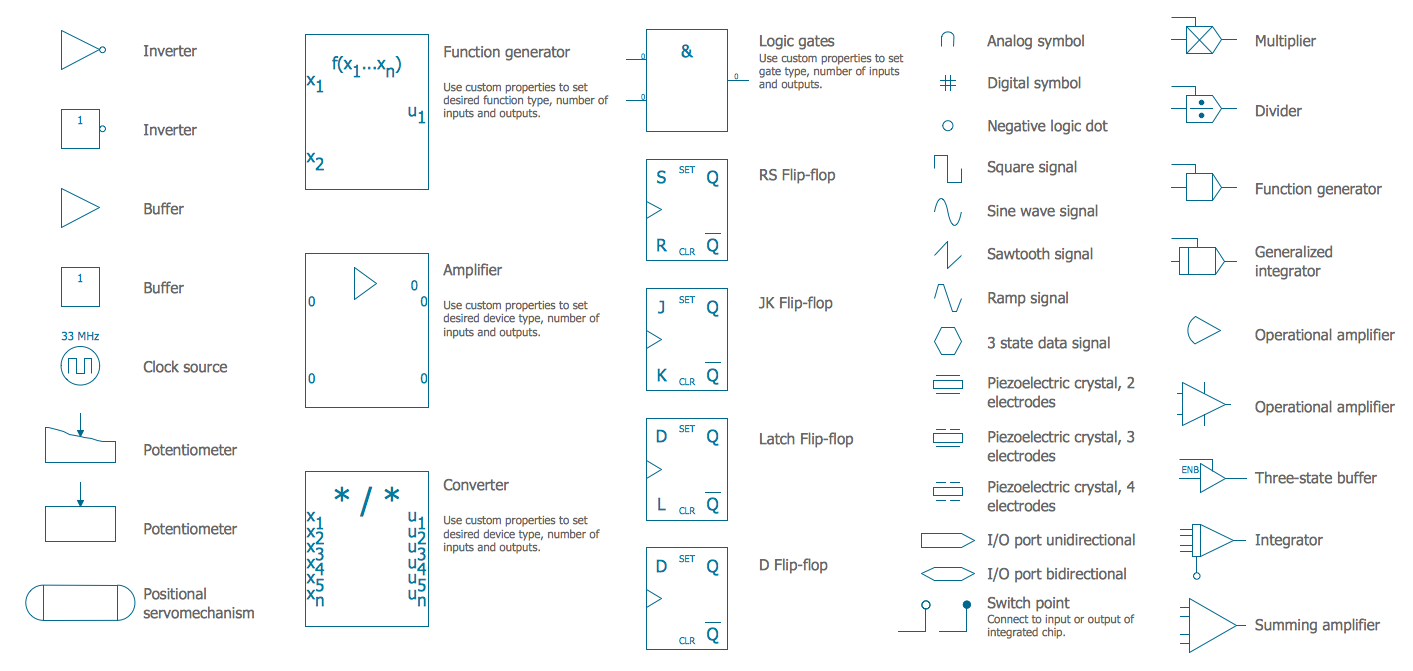
Electrical Symbols — Analog and Digital Logic

Digital electronics or digital (electronic) circuits are electronics that handle digital signals – discrete bands of analog levels – rather than by continuous ranges (as used in analogue electronics). All levels within a band of values represent the same numeric value. Because of this discretization, relatively small changes to the analog signal levels due to manufacturing tolerance, signal attenuation or parasitic noise do not leave the discrete envelope, and as a result are ignored by signal state sensing circuitry.

26 libraries of the Electrical Engineering Solution of ConceptDraw DIAGRAM make your electrical diagramming simple, efficient, and effective. You can simply and quickly drop the ready-to-use objects from libraries into your document to create the electrical diagram.

SSADM Diagram

The vector stencils library SSADM from the solution Systems engineering contains specific symbols of SSADM diagrams for ConceptDraw DIAGRAM diagramming and vector drawing software. The Systems engineering solution is contained in Software Development area of ConceptDraw Solution Park.
The example below illustrates the waterfall model used in SSADM. This model involves 5 stages of developing a product such as requirements specification and its' analysis, design, coding and testing.

Best Multi-Platform Diagram Software

ConceptDraw DIAGRAM is a powerful tool for drawing business communication ideas and concepts, simple visual presentation of numerical data in the Mac environment.

Flow Diagram Software

ConceptDraw is a professional Process Flow Diagram software. The basic set of the stencils libraries, samples and templates allows you to draw any type of flowchart. Flowcharts give to users the ability to represent structural data visually. One can draw own flowchart in seconds by using RapidDraw technology.

Entity Relationship Software

Entity Relationship Diagrams (ERD) illustrate the logical structure of databases.
The vector graphic diagrams produced when using the ConceptDraw ERD solution can be used in whitepapers, presentations, datasheets, posters, or any technical materials.
It is convenient to design ER Diagrams using ConceptDraw DIAGRAM software. ConceptDraw DIAGRAM extended with the Entity-Relationship Diagram (ERD) solution supports Chen's and Crow’s Foot notations that are often used to describe database structure.

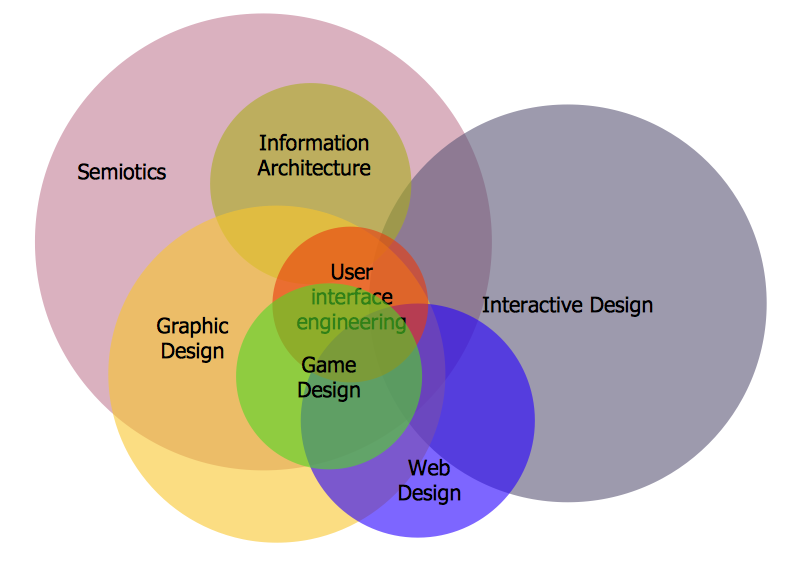
Venn Diagram Examples for Problem Solving. Venn Diagram as a Truth Table

Venn diagrams are illustrations used in the branch of mathematics known as set theory. They show the mathematical or logical relationship between different groups of things (sets). A Venn diagram shows all the possible logical relations between the sets.

Wiring Diagrams with ConceptDraw DIAGRAM

A wiring diagram is a comprehensive diagram of each electrical circuit system showing all the connectors, wiring, terminal boards, signal connections (buses) between the devices and electrical or electronic components of the circuit. It also identifies the wires by wire numbers or colour coding. Wiring diagrams are necessary to troubleshoot and fix electrical or electronic circuits.

Interactive Venn Diagram

Venn Diagrams Solution offers you the Venn Diagrams library of ready-to-use vector objects and large collection of templates and samples allowing you create your own Interactive Venn Diagram in minutes.
Venn Diagrams designed in ConceptDraw DIAGRAM are visual, bright, colorful, so they can be successfully used in different reports, appearances on the conferences, meetings.

network topology diagram software, network icons, network diagram template, networking icons available, how to draw a network diagram Computer Network Diagrams

network topology diagram software, network icons, network diagram template, networking icons available, how to draw a network diagram
Computer Network Diagrams solution extends ConceptDraw DIAGRAM software with samples, templates and libraries of vector icons and objects of computer network devices and network components to help you create professional-looking Computer Network Diagrams, to plan simple home networks and complex computer network configurations for large buildings, to represent their schemes in a comprehensible graphical view, to document computer networks configurations, to depict the interactions between network's components, the used protocols and topologies, to represent physical and logical network structures, to compare visually different topologies and to depict their combinations, to represent in details the network structure with help of schemes, to study and analyze the network configurations, to communicate effectively to engineers, stakeholders and end-users, to track network working and troubleshoot, if necessary.