Bubble diagrams with ConceptDraw DIAGRAM
Using ConceptDraw you will be able to create bubble diagrams from the ready ConceptDraw library objects or make your own objects. The created diagram can be saved and edited, objects can be moved and links between them will be automatically repainted after object moving because of using the ConceptDraw connectors.Best Multi-Platform Diagram Software
ConceptDraw DIAGRAM is a powerful tool for drawing business communication ideas and concepts, simple visual presentation of numerical data in the Mac environment.Create Block Diagram
Block diagrams solution extends ConceptDraw DIAGRAM software with templates, samples and libraries of vector stencils for creating the block diagram.Create block diagrams, electrical circuit diagrams, schematics, and more in minutes with ConceptDraw DIAGRAM.
How to Draw a Bubble Chart
Video tutorials on ConceptDraw products. Try it today!Bubble Charts
Bubble Charts are convenient way to visualize ideas and concepts by organizing them in a hierarchy. To show the importance of ideas you can use different bubble sizes and colors. ConceptDraw DIAGRAM diagramming and vector drawing software extended with Bubble Diagrams Solution from the "Diagrams" Area affords you the easiest and fastest way for designing professional looking Bubble Charts.Bubble Diagrams
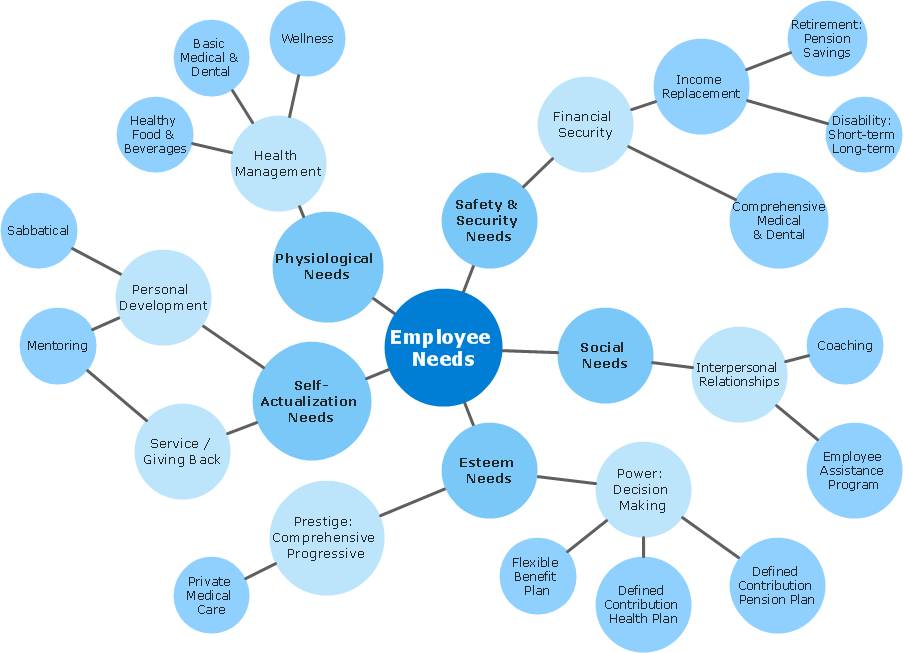
Bubble diagrams have enjoyed great success in software engineering, architecture, economics, medicine, landscape design, scientific and educational process, for ideas organization during brainstorming, for making business illustrations, presentations, planning, design, and strategy development. They are popular because of their simplicity and their powerful visual communication attributes.
ConceptDraw Arrows10 Technology
Connecting objects manually in ConceptDraw DIAGRAM is a snap:- points;
- Connecting groups of objects;
- Auto-routing;
- Connectors text;
- Snap to Guides ;
- Quick.
HelpDesk
How to Add a Bubble Diagram to PowerPoint Presentation
Bubble diagrams can be used to compare concepts and identify areas of similarity and difference. ConceptDraw DIAGRAM allows you to make an MS PowerPoint Presentation from your charts in a few simple steps. A bubble diagram is a chart that represents information visually in the form of a series of bubbles. Bubble charts are often used in marketing and management during the early stages of product development to visualize ideas and concepts by organizing them in a hierarchy. The ability to create this form of a diagram is contained within the Bubble Diagrams solution. A PowerPoint presentation of bubble diagrams can be used to demonstrate and identify areas of similarity and difference of featured business ideas and concepts.Examples of Flowcharts, Org Charts and More
ConceptDraw examples covers a broad spectrum of business graphics categories. We separated all the graphic documents on application areas and had produced multiple solutions for each of them. ConceptDraw provides a wide variety of examples such as flowcharts, organizational charts, business charts, UML diagrams, database and ERD, directional map, network diagrams and lots more. Each solution accommodates 10+ examples that shows specific application cases of a diagram. ConceptDraw STORE is an application for downloading solutions with examples, templates and stencil libraries. Please choose any examples you are interested in, alternatively download them for free; you will need to install ConceptDraw to view them. As you will see, ConceptDraw is very powerful, you can use more than 10000 symbols, examples, and many pre-drawn templates, to create your own spectacular flowcharts, business diagrams, network diagrams and lots more, effortlessly, and in no time at all.ConceptDraw Arrows10 Technology
Auto-connection mode - This is more than enough versatility to draw any type of diagram with any degree of complexity.How should diagramming software work? Is it possible to develop a diagram as quickly as the ideas come to you? The innovative Auto-connection mode is what you need to start draw.
Affinity Diagram
The Affinity Diagram shows the structure of large, complex factors that have an influence on a problem, and then divides them up into a smaller and simpler structure. The Affinity Diagram does not show a causal relationship between the factors. This diagram is designed to prepare the data for further analysis of the cause-effect relationships.The Best Mac Software for Diagramming or Drawing
ConceptDraw DIAGRAM is a powerful intelligent vector graphics engine that can be used to create basic diagrams including flowcharts, charts, workflows, flowcharts, organizational charts, business diagram, learn business diagrams, flow diagrams.ConceptDraw Arrows10 Technology
How should diagramming software work? The answer is - Fast and easy."Tree"- mode drawing works like that. Just select objects in your drawing and press Tree or Chain button to connect all of them just in one click.
Your diagram looks professional and it took only a moment to draw.
Office Ideas
ConceptDraw DIAGRAM diagramming and vector drawing software offers the Office Layout Plans Solution from the Building Plans Area of ConceptDraw Solution Park with powerful tools to help you depict your construction and design Office Ideas.- Top Ipad Diagramming Apps Grafio Diagrams Ideas
- Bubble diagrams with ConceptDraw PRO | How to Draw a Bubble ...
- How To Create Good Presentation Ideas | Timeline Diagrams ...
- Process Flowchart | Cafe Design Ideas | Bubble diagrams in ...
- Office Layout Plans | Bubble Diagrams | Reflected Ceiling Plans ...
- How To Make a Bubble Chart | Bubble diagrams with ConceptDraw ...
- Bubble diagrams in Landscape Design with ConceptDraw PRO ...
- How to Add a Bubble Diagram to a PowerPoint Presentation Using ...
- Design Element: Rack Diagram for Network Diagrams | Office Ideas ...
- Bubble Diagrams | Bubble diagrams in Landscape Design with ...
- Bubble diagram - Template | Bubble diagrams in Landscape Design ...
- Bubble diagrams with ConceptDraw PRO | Mac Compatible Remote ...
- Bubble Diagram Software
- Reflected Ceiling Plans | Ceiling Design Ideas | Ceiling Ideas For ...
- Basic Flowchart Symbols and Meaning | How to Draw a Bubble ...
- Total Quality Management TQM Diagrams | The Fifty Two Elements ...
- Marketing | How Do Fishbone Diagrams Solve Manufacturing ...
- Bubble Diagrams | How To Create a Bubble Chart | CAD Drawing ...
- UML communication diagram - Client server access | Local network ...
- Entity-Relationship Diagram (ERD) | Chemistry | Cafe Design Ideas ...
- ERD | Entity Relationship Diagrams, ERD Software for Mac and Win
- Flowchart | Basic Flowchart Symbols and Meaning
- Flowchart | Flowchart Design - Symbols, Shapes, Stencils and Icons
- Flowchart | Flow Chart Symbols
- Electrical | Electrical Drawing - Wiring and Circuits Schematics
- Flowchart | Common Flowchart Symbols