This site uses cookies. By continuing to browse the ConceptDraw site you are agreeing to our Use of Site Cookies.

A KPI Dashboard

Composing a dashboard from different KPI is a kind of art. Visualizing sales data you have to keep balance to keep your dashboard informative, not messy. ConceptDraw Sales Dashboard solution gives you a set of good examples of balanced dashboards.

A KPI Dashboard Provides the Answers Your Sales Team

Sales dashboard is a tool that provides the answers to all questions your sales team may have. A mature sales dashboard provides complete set of KPI to shows corporate, team or personal performance to keep sales process clear.

Sales KPI Dashboards

A combination of sales KPI on a one dashboard helps you track sales activities and results. Visualizing sales data using ConceptDraw DIAGRAM software extended with the Sales Dashboard solutiongives you flexibility in choosing and tuning KPIs.

Data Visualization Software Solutions

To see how your business can improve you can try data visualization software solutions that allows you visualize all your sales KPI in one sales dashboard allows you monitor and analyse sales activities.

KPIs and Metrics

The choice of KPIs and metrics you use is key point of success when measuring sales process. Visualizing sales data using ConceptDraw Sales Dashboard solution for ConceptDraw DIAGRAM gives you a choice from numerous pre-designed indicators for different metrics you may need.

Measure the Progress

Visualizing sales data using Sales Dashboard solution for ConceptDraw DIAGRAM helps you measure the progress of your sales team. You can measure corporate, team and personal progress combining different KPI on your sales dashboard.

Sales Dashboard Solutions can help your sales team keep an eye on performance

ConceptDraw Sales Dashboard Solution is a simple and effective way of visualizing sales data and get clear picture of your sales process to see how your business can improve.

Sales Dashboards for Your Company

ConceptDraw DIAGRAM software extended with the Sales Dashboard solution allows you produce sales dashboards for your company easily. You can start from samples and templates delivered with the solution and then modify them to get a dashboard that suites your specific needs.

Sales Organization

Sales organization becomes easier when you have proper tools to motivate your team and measure team and personal progress. ConceptDraw Sales Dashboard helps you in sales organization visualizing sales data that gives your team a visual appearance of their progress.

The Facts and KPIs

Visualizing sales data help you see the facts and KPIs about your sales process to make conclusions and see how your business can improve.

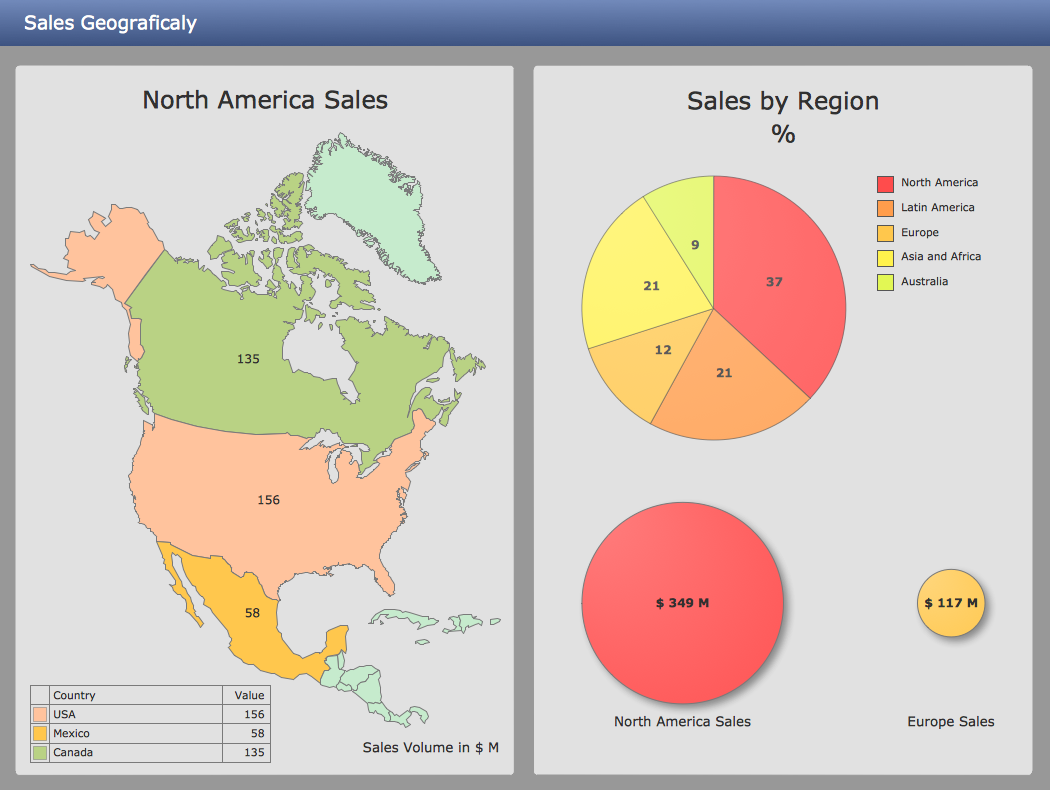
Visualize Sales Data Using Sample Data

ConceptDraw DIAGRAM software extended with the Sales Dashboard solution allows you visualize sales data using sample data delivered with the solution to choose visual indicators you need, and then connect these indicators to your real data.

Data Visualization Solutions

Data visualization solutions help you to see how your business can improve. Visualizing sales data using ConceptDraw Sales Dashboard gives you a bird's-eye view of the sale process.

Business Graphics Software

ConceptDraw DIAGRAM is a business graphics software that allows you improve your business using Sales Performance Dashboard helps you analyze your data more efficiently.

Sales Teams are Inherently Competitive

Sales teams are inherently competitive, so you don't need to invent extra ways to stimulate the competition. At the same time, you can provide the team with a sales dashboard shows company, team and personal KPI to make the competition clear.

How To Create Project Report

ConceptDraw PROJECT contains an extensive tool set to help project managers. The rich data visualization capability that is provided by ConceptDraw products helps you create project dashboards, one-click reports, multi-project views, Gantt charts, and resource views. Let′s learn how to get maximum value using ConceptDraw PROJECT!

Ways You Can Visualize Sales Data

There are lots of ways you can visualize sales data, and the simplest way is using ConceptDraw Sales Dashboard solution for ConceptDraw DIAGRAM. You just need to connect your data to one of pre-designed dashboards, and then you can see dynamic picture of changes.

Sales Dashboard Screenshot

ConceptDraw DIAGRAM software exteneded with the Sales Dashboard solution is perfect for visualizing sales data. This is the best tool to analyse your sales perfornance and see how your business can improve.

sales dashboard, sales metrics Sales Dashboard

sales dashboard, sales metrics
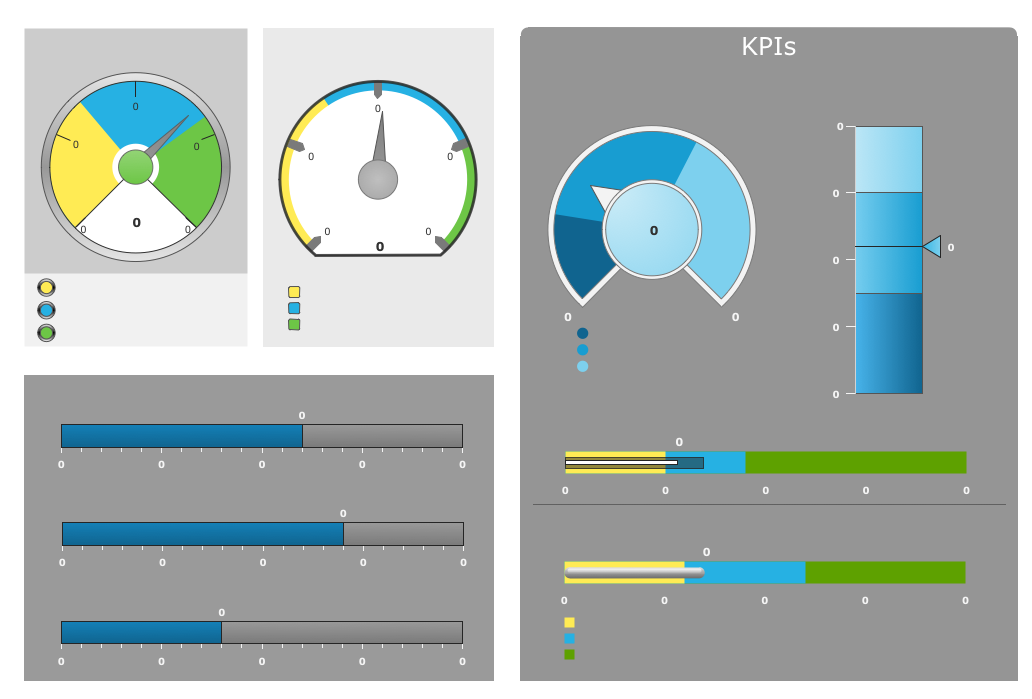
Sales Dashboard solution extends ConceptDraw DIAGRAM software with templates, samples and library of vector stencils for drawing the visual dashboards of sale metrics and key performance indicators (KPI).

project management, dashboards, project, project indicators, KPI, key performance indicato PM Dashboards

project management, dashboards, project, project indicators, KPI, key performance indicato
The PM Dashboards solution extends the management boundaries of ConceptDraw DIAGRAM and ConceptDraw PROJECT products with an ability to demonstrate changes to the budget status, to show the project progress toward its objectives, to display clearly the identified key performance indicator (KPI) or the set of key performance indicators for any project. This solution provides you with examples and ability to generate three types of visual dashboards reports based on your project data Project Dashboard, Tactical Dashboard, and Radar Chart. By dynamically charting the project’s key performance indicators that are collected on one ConceptDraw DIAGRAM document page, all project participants, project managers, team members, team leaders, stakeholders, and the entire organizations, for which this solution is intended, have access to the daily status of projects they are involved in.

Business Diagram Software

ConceptDraw business diagram Software is the most powerful business and relational charting software. Create advanced, completely customizable flow charts, organizational charts, business process diagrams, work flow diagrams, audit diagram, value stream maps, TQM diagrams, ERD diagrams, EPC diagrams, marketing diagrams, cause and effect diagrams, dashboards, infographics and other relational business diagrams from your data.
Business Process Modeling