This site uses cookies. By continuing to browse the ConceptDraw site you are agreeing to our Use of Site Cookies.

Data Modeling Diagram

The vector stencils library Activity diagrams from the solution Rapid UML contains specific data modeling symbols for ConceptDraw DIAGRAM diagramming and vector drawing software. The Rapid UML solution is contained in the Software Development area of ConceptDraw Solution Park.

Data Modeling with Entity Relationship Diagram

Data modeling is actively applied in analysis and uses wide set of methods for description the data requirements in a system. One of the most popular and well-known is the ERD method of database modeling.
The best ERD tool for the Mac and Windows is ConceptDraw DIAGRAM software extended with the Entity-Relationship Diagram (ERD) solution from the Software Development Area for ConceptDraw Solution Park, which is sharpened for professional ERD drawing and data modeling with Entity Relationship Diagram.

Data modeling with ConceptDraw DIAGRAM

Data modelling will help you to study and analyze business processes in your organization for optimization and increase of effectiveness and production.

Express-G Diagram

The vector stencils library from the solution Information Model Diagrams contains specific data type symbols of the EXPRESS-G notation such as entity data type symbols, simple data type symbols, enumeration data type symbols, defined data type symbols, select data type symbols and specific attribute symbols for ConceptDraw DIAGRAM diagramming and vector drawing software. The Information Model Diagrams solution is contained in the Software Development area of ConceptDraw Solution Park.

Martin ERD Diagram

The vector stencils library Crow's Foot Notation from the solution Entity-Relationship Diagrams (ERD) contains specific symbols of the Crow's foot notation such as relationship symbols and entity symbols for ConceptDraw DIAGRAM diagramming and vector drawing software. The Entity-Relationship Diagrams (ERD) solution is contained in the Software Development area of ConceptDraw Solution Park.

ORM Diagram

The vector stencils library ORM Diagrams from the solution Software Development contains specific ORM symbols for ConceptDraw DIAGRAM diagramming and vector drawing software. The Software Development solution is contained in the ConceptDraw Solution Park.

Structured Systems Analysis and Design Method (SSADM) with ConceptDraw DIAGRAM

Structured Systems Analysis and Design Method SSADM is the method which is used at projecting and analysis of information systems. SSADM is based on the data flow diagrams. At the description of data flows out of the system and into the system DFD, which denote boundaries of the system, are used.

Chen ERD Diagram

The vector stencils library Chen ERD from the solution Entity-Relationship Diagrams (ERD) contains specific symbols of the Chen ERD notation including entity symbols and relationship symbols for ConceptDraw DIAGRAM diagramming and vector drawing software. The Entity-Relationship Diagrams (ERD) solution is contained in the Software Development area of ConceptDraw Solution Park.

ConceptDraw DIAGRAM Database Modeling Software

ConceptDraw DIAGRAM is a very easy-to-use and intuitive database design tool which can save you hundreds of work hours. See database diagram samples created with ConceptDraw DIAGRAM database modeling database diagram software.

Data Flow Diagram Model

The DFD (Yourdon and Coad notation) example "Model of small traditional production enterprise" below was created using the ConceptDraw DIAGRAM diagramming and vector drawing software extended with the Data Flow Diagrams solution from the Software Development area of ConceptDraw Solution Park.

Data structure diagram with ConceptDraw DIAGRAM

Data structure diagram (DSD) is intended for description of conceptual models of data (concepts and connections between them) in the graphic format for more obviousness. Data structure diagram includes entities description, connections between them and obligatory conditions and requirements which connect them. Create Data structure diagram with ConceptDraw DIAGRAM.

SSADM Diagram

The vector stencils library SSADM from the solution Systems engineering contains specific symbols of SSADM diagrams for ConceptDraw DIAGRAM diagramming and vector drawing software. The Systems engineering solution is contained in Software Development area of ConceptDraw Solution Park.
The example below illustrates the waterfall model used in SSADM. This model involves 5 stages of developing a product such as requirements specification and its' analysis, design, coding and testing.

Entity Relationship Diagram Examples

Create an Entity-Relationship (ER) model is to visually represent the structure of a business database, where data equates to entities (or objects) that are linked by defined relationships expressing dependencies and requirements. By nature it is an abstract visualization, the first step in the design process towards creating a logical and functional database.

ConceptDraw DIAGRAM diagramming and vector drawing software gives the ability to describe a database using the Entity-Relationship model. Entity-Relationship Diagram(ERD) solution from the Software Development area supplies the ConceptDraw DIAGRAM with icons advocated by Chen's and Crow’s Foot notation that can be used when describing a database.
How to Build an Entity Relationship Diagram (ERD)

Data Flow Diagram Process

This example is created using ConceptDraw DIAGRAM enhanced with solution Data Flow Diagrams. It shows the process of account receivable.
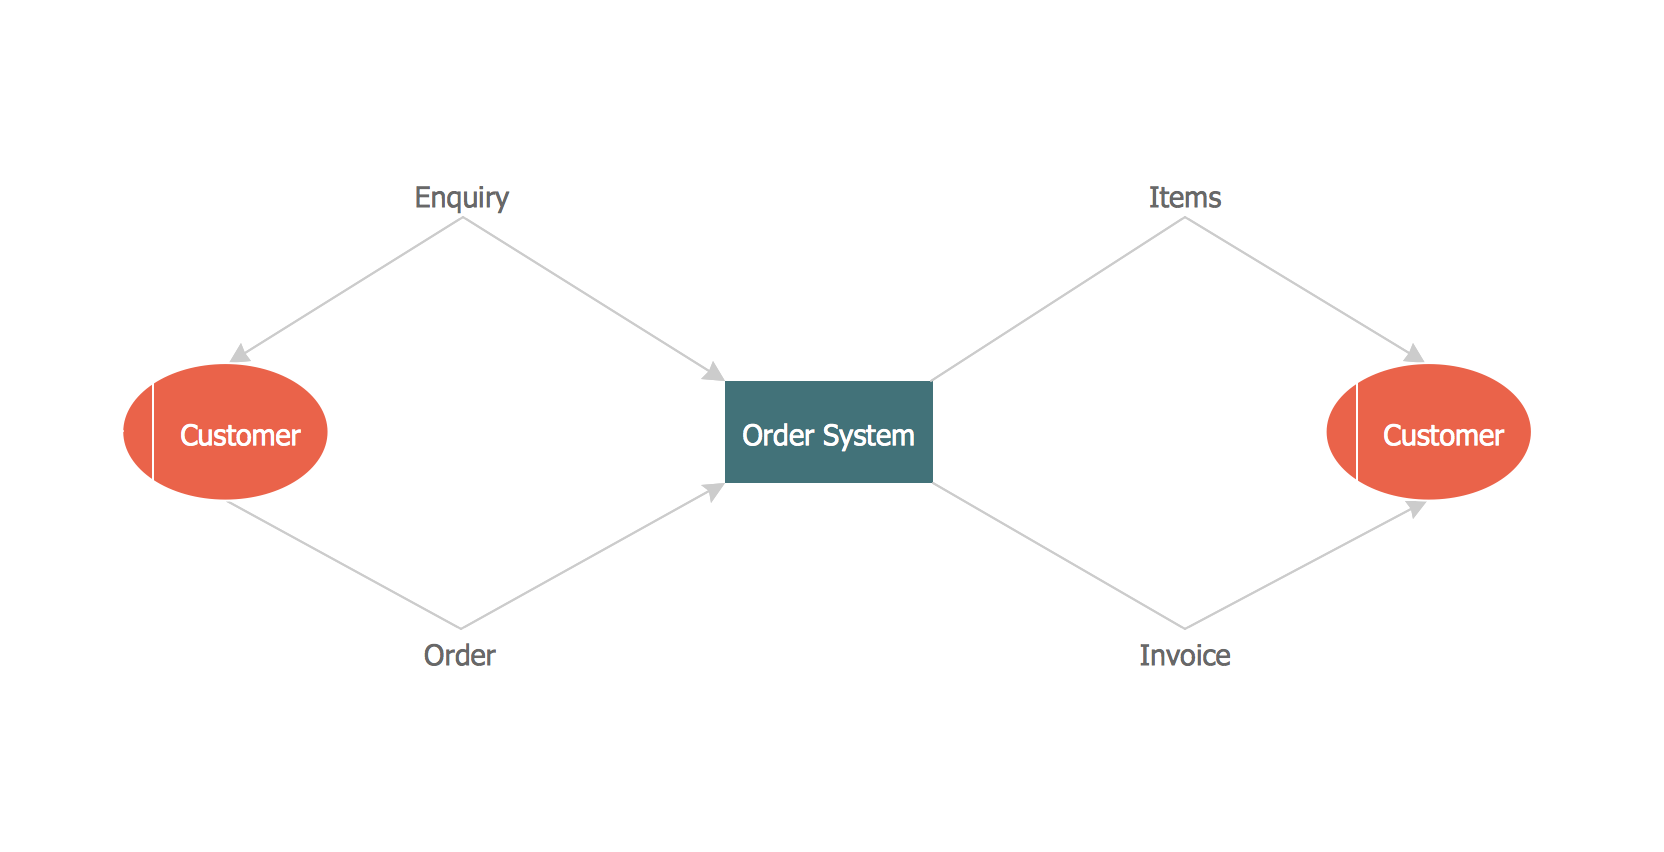
"A data flow diagram (DFD) is a graphical representation of the "flow" of data through an information system. It differs from the flowchart as it shows the data flow instead of the control flow of the program. A data flow diagram can also be used for the visualization of data processing (structured design). Data flow diagrams were invented by Larry Constantine, the original developer of structured design, based on Martin and Estrin's "data flow graph" model of computation.
It is common practice to draw a context-level Data flow diagram first which shows the interaction between the system and outside entities. The DFD is designed to show how a system is divided into smaller portions and to highlight the flow of data between those parts. This context-level Data flow diagram is then "exploded" to show more detail of the system being modeled" [Data model. Wikipedia]
The DFD (Yourdon and Coad notation) example "Model of small traditional production enterprise" was created using the ConceptDraw PRO diagramming and vector drawing software extended with the Data Flow Diagrams solution from the Software Development area of ConceptDraw Solution Park.
Data Flow Diagram Model
Data Flow Diagram Model, process, external interactor, data store,

Data flow Model Diagram

This sample was created in ConceptDraw DIAGRAM diagramming and vector drawing software using the Data Flow Diagrams Solution from the Software Development area of ConceptDraw Solution Park.
This sample shows the Data Flow Model Diagram that displays the Order system and the interactions between the Order system and Customers.

Data Flow Diagram

Data flow diagram (DFD) is the part of the SSADM method (Structured Systems Analysis and Design Methodology), intended for analysis and information systems projection. Data flow diagrams are intended for graphical representation of data flows in the information system and for analysis of data processing during the structural projection. Data flow diagram often used in connection with human process and can be displayed as workflow diagram. The critical Process Flow Diagram is another flowchart technique for designing data flow in connection with organizational processes. The critical Process flow diagram may use different range of symbols than a classic workflow diagram.

Program Structure Diagram

Program Structure Diagram - The Software Development solution from ConceptDraw Solution Park provides the stensils libraries of language level shapes and memory objects for drawing the structural diagrams of programs and memory objects using the ConceptDraw DIAGRAM diagramming and vector drawing software.

Gane Sarson Diagram

The vector stencils library Gane-Sarson Notation from the solution Data Flow Diagrams contains specific symbols of the Gane-Sarson notation such as process symbol, connector symbol, jump symbol for ConceptDraw DIAGRAM diagramming and vector drawing software. The Data Flow Diagrams solution is contained in the Software Development area of ConceptDraw Solution Park.

Software Diagrams

Design and document development of projects using a wide range of pre-drawn shapes and smart connectors. Develop visualization solutions with the help of the built-in scripting language.
ConceptDraw DIAGRAM is a perfect tool for Designing and planning tasks; Developing Visualization Solutions; Project Planning (Gantt Charts, Timelines, Project Schedules).