Value Stream Diagram

What is Value Stream Mapping?

HelpDesk
How to Create a VSM Diagram Using Solutions

Value Stream Mapping Template

Best Value Stream Mapping mac Software

Lean Value Stream Map

Sections of the Value Stream Map

 Value Stream Mapping
Value stream mapping solution extends ConceptDraw DIAGRAM software with templates, samples and vector stencils for drawing the Value Stream Maps (VSM) in lean manufacturing practice.
Value Stream Mapping

Best Value — Total Quality Management

Value Stream Management

 Customer Journey Mapping
Customer Journey Mapping Solution for ConceptDraw DIAGRAM opens incredibly broad opportunities for marketing and business specialists, product managers, designers, engineers, and other people interested in business development, increasing the product’s audience, its success and users' demand, providing them with capabilities of customer journey mapping. The included diagramming and customer journey mapping tools, predesigned vector customer journey mapping icons and charts, consumer journey mapping connectors, user journey and customer mapping figures, customer experience map icons and touchpoint icons, quick-start templates and samples provide excellent conditions for the customer journey mapping process, for creating Customer Journey Map and Customer Experience Map.
 Marketing Diagrams
Marketing Diagrams solution extends ConceptDraw DIAGRAM diagramming software with abundance of samples, templates and vector design elements intended for easy graphical visualization and drawing different types of Marketing diagrams and graphs, including Branding Strategies Diagram, Five Forces Model Diagram, Decision Tree Diagram, Puzzle Diagram, Step Diagram, Process Chart, Strategy Map, Funnel Diagram, Value Chain Diagram, Ladder of Customer Loyalty Diagram, Leaky Bucket Diagram, Promotional Mix Diagram, Service-Goods Continuum Diagram, Six Markets Model Diagram, Sources of Customer Satisfaction Diagram, etc. Analyze effectively the marketing activity of your company and apply the optimal marketing methods with ConceptDraw DIAGRAM software.
Customer Relationship Management

Pyramid Diagram and Pyramid Chart

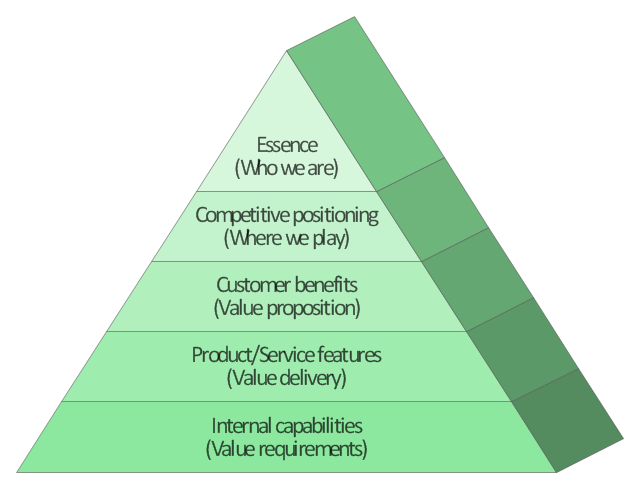
This market value pyramid diagram has 5 levels:
1) Essence (Who we are),
2) Competitive positioning (Where we play),
3) Customer benefits (Value proposition),
4) Product / Service features (Value delivery),
5) Internal capabilitiea (Value requirements).
Use this triangular scheme to develop your marketing strategy.
"Market value or OMV (Open Market Valuation) is the price at which an asset would trade in a competitive auction setting. Market value is often used interchangeably with open market value, fair value or fair market value, although these terms have distinct definitions in different standards, and may differ in some circumstances." [Market value. Wikipedia]
The triangle chart example "Market value" was created using the ConceptDraw PRO diagramming and vector drawing software extended with the Pyramid Diagrams solution from the Marketing area of ConceptDraw Solution Park.
Pyramid diagram
How to Prepare Learning Presentations for Training

Value stream with ConceptDraw DIAGRAM

Value Stream & Process Flow Diagramming Software

- Diagram Of Customer Market
- Lean Manufacturing Diagrams | Value Stream Mapping | Types of ...
- Value stream mapping diagram
- Leaky bucket diagram | Marketing Diagrams | Competitor Analysis ...
- Value stream map - Template | Design elements - Value stream ...
- Marketing - Vector stencils library | Rack Diagrams | With The Aid Of ...
- What is Value Stream Mapping?
- Value Stream Mapping | ConceptDraw Arrows10 Technology ...
- Competitor Analysis | Total Quality Management Value | Matrices ...
- Manufacturing and Maintenance | Value -Stream Mapping for ...
- Ladder of customer loyalty diagram | Marketing diagrams - Vector ...
- Logistics Flow Charts | A Study of the Business Value of Total ...
- Funnel Diagrams | Best Value Stream Mapping mac Software ...
- Value stream mapping - Vector stencils library | Circuits and Logic ...
- Cloud marketing diagram | Marketing Analysis Diagram | Marketing ...
- Total Quality Management Value | Fishbone Diagram | 4ms Of ...
- Block diagram - Sources of customer satisfaction | Marketing ...
- Press Releases - ConceptDraw
- Total Quality Management TQM Diagrams
- Leaky bucket diagram | Customer Defection Rate Is A Leaking Bucket