 Timeline Diagrams
Timeline Diagrams solution extends ConceptDraw DIAGRAM diagramming software with samples, templates and libraries of specially developed smart vector design elements of timeline bars, time intervals, milestones, events, today marker, legend, and many other elements with custom properties, helpful for professional drawing clear and intuitive Timeline Diagrams. Use it to design simple Timeline Diagrams and designate only the main project stages, or highly detailed Timeline Diagrams depicting all project tasks, subtasks, milestones, deadlines, responsible persons and other description information, ideal for applying in presentations, reports, education materials, and other documentation.
"Value Stream Mapping (VSM):
– Special type of flow chart that uses symbols known as "the language of Lean" to depict and improve the flow of inventory information. ...
Value Stream Mapping ...
Provide optimum value to the customer through a complete value creation process with minimum waste in:
– Design (concept to customer);
– Design (concept to customer);
– Build (order to delivery);
– Sustain (in-use through life cycle to service)." [courses.washington.edu/ ie337/ Value_ Stream_ Mapping.pdf]
This sample Value Stream Map shows how customer value is created in the steps of manufacturing, production control, and shipping processes.
This VSM example was created using the ConceptDraw PRO diagramming and vector drawing software extended with the Value Stream Mapping solution from the Quality area of ConceptDraw Solution Park.
Value stream mapping

Learn how to create a current state value stream map

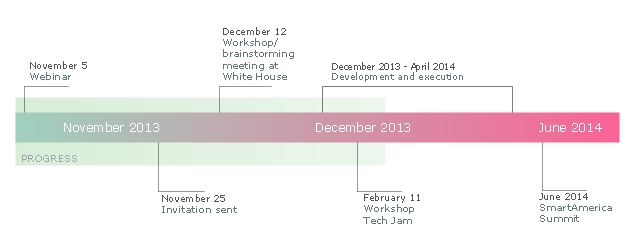
This sample was created on the base of the figure illustrating the webpage "SmartAmerica Challenge Timeline" from the website of the National Institute of Standards and Technology (NIST), an agency of the U.S. Department of Commerce. [nist.gov/ el/ sactl.cfm]
"The SmartAmerica Challenge is a White House Presidential Innovation Fellow project with the goal to bring together research in Cyber-Physical Systems (CPS) and to combine test-beds, projects and activities from different sectors, such as Smart Manufacturing, Healthcare, Smart Energy, Intelligent Transportation and Disaster Response, to show tangible and measurable benefits to the US economy and the daily lives of American citizens.
Cyber-Physical Systems is a name for the combination of the Internet of Things and System Control. So rather than just being able to “sense” where something is, CPS adds the capability to control the “thing” or allow it to interact with physical world around it.
Over 65 Companies, Government Agencies and Academic institutions came together on December 12, 2013 and launched 12 teams/ projects. Since that time 12 new projects have been formed. These teams have been hard at work over the past months building systems, prototypes, pilots and products that demonstrate the capabilities of CPS, but more importantly as the goal of the SmartAmerica Challenge they will show how these technologies will deliver socio-economic benefits to America.
The Challenge will culminate with the SmartAmerica Expo on June 11 at the Washington DC Convention Center." [smartamerica.org/ about/ ]
The timeline diagram example "" was created using the ConceptDraw PRO diagramming and vector drawing software extended with the Timeline Diagrams solution from the Management area of ConceptDraw Solution Park.
Timeline diagram
 Manufacturing and Maintenance
Manufacturing and maintenance solution extends ConceptDraw DIAGRAM software with illustration samples, templates and vector stencils libraries with clip art of packaging systems, industrial vehicles, tools, resources and energy.
Create a Value Stream Map

"Value Stream Map (VSM)
1. A tool used to improve a process by identifying added value and eliminating waste.
2. A process map that follows the value creation process.
A. “strap yourself to the product (or service) and see where you go”
3. A process map with data added.
A. Times: processing, wait, cycle.
B. Quality: number of rejects.
C. Inventory.
D. Resources.
1) Number of people.
2) Space.
3) Distance traveled.
E. Whatever else is useful for analyzing the process." [ocw.mit.edu/ courses/ aeronautics-and-astronautics/ 16-660j-introduction-to-lean-six-sigma-methods-january-iap-2012/ lecture-notes/ MIT16_ 660JIAP12_ 1-6.pdf]
This sample VSM flowchart shows the value stream in a manufacturing, production control and shipping processes.
This value stream mapping diagram example was created using the ConceptDraw PRO diagramming and vector drawing software extended with the Value Stream Mapping solution from the Quality area of ConceptDraw Solution Park.
Value stream mapping

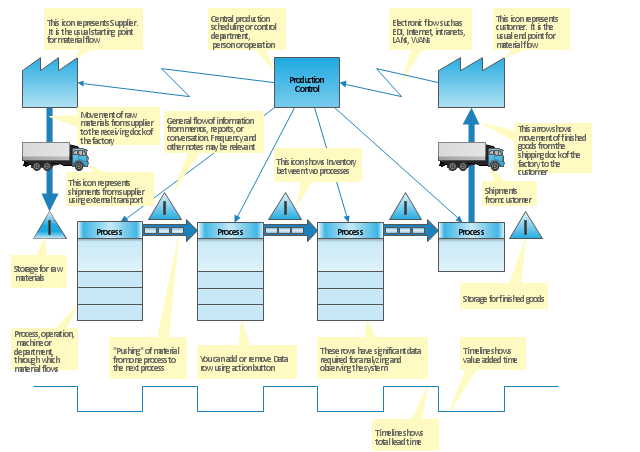
"Value stream mapping is a lean management principle used to analyze and design the flow of materials and information required to bring a product or service to a consumer. Pioneered by Henry Ford in the 1920s, perfected by Toyota. At Toyota, it is known as "material and information flow mapping". It can be applied to nearly any value chain. ...
Value stream mapping has supporting methods that are often used in Lean environments to analyze and design flows at the system level (across multiple processes).
Although value stream mapping is often associated with manufacturing, it is also used in logistics, supply chain, service related industries, healthcare, software development, product development, and administrative and office processes." [Value stream mapping. Wikipedia]
This value stream map template explains the meanings of the VSM design elements.
This Value stream map template for the ConceptDraw PRO diagramming and vector drawing software is included in the Value Stream Mapping solution from the Quality area of ConceptDraw Solution Park.
VSM template
 EXPRESS-G data Modeling Diagram
EXPRESS-G data Modeling Diagram solution extends the ConceptDraw DIAGRAM software functionality with capabilities of EXPRESS data modeling language, includes powerful data modeling tools, Express-G diagram tool, database diagram tool, database design tool, wide variety of pre-made vector objects of EXPRESS-G notation and EXPRESS-G diagrams samples allowing software developers, software designers, software engineers and other stakeholders to make their data models for information systems, to develop the databases, to learn the principles of construction EXPRESS-G diagrams and helping to draw their own EXPRESS-G Data Modeling Diagrams, Express-G Diagrams or Database Model Diagram without any efforts.
 Enterprise Architecture Diagrams
Enterprise Architecture Diagrams solution extends ConceptDraw DIAGRAM software with templates, samples and library of vector stencils for drawing the diagrams of enterprise architecture models.
Activity Network Diagram Method

 Plant Layout Plans
Plant Layout Plans solution can be used for power plant design and plant layout design, for making the needed building plant plans and plant layouts looking professionally good. Having the newest plant layout software, the plant design solutions and in particular the ConceptDraw’s Plant Layout Plans solution, including the pre-made templates, examples of the plant layout plans, and the stencil libraries with the design elements, the architects, electricians, interior designers, builders, telecommunications managers, plant design engineers, and other technicians can use them to create the professionally looking drawings within only a few minutes.
How To create Value Stream Map (VSM)
 *")
 Fishbone Diagrams
The Fishbone Diagrams solution extends ConceptDraw DIAGRAM software with the ability to easily draw the Fishbone Diagrams (Ishikawa Diagrams) to clearly see the cause and effect analysis and also problem solving. The vector graphic diagrams produced using this solution can be used in whitepapers, presentations, datasheets, posters, and published technical material.
Model Based Systems Engineering

 Visual Reports
The Visual Reports solution extends abilities of ConceptDraw PROJECT by creating the illustrative, informative, colourful and comprehensible reports on a project in a form of visual graphs and diagrams of common types, such as Bar Charts, Pie Charts, Line Charts, Divided Bar Charts, Timelines, Dial Dashboards. This highly effective project management tool helps project managers and other stakeholders to report about the tasks statuses, the project progress and degree of its completion, to evaluate the project status, to depict the project expenses by days and to define the days that go beyond the budget, to compare visually the actual expenses and expected ones at the project planning stage, to generate the Resource chart depicting the utilization of project resources by days, and to show other useful information. The set of tailor-made examples developed for the Visual Reports solution allows designating advantages of each type of report included to this solution for the further use in your management work.
Lean Six Sigma Diagram Software

- Timeline Diagrams | Examples Of Process Timelines
- Business Processes | Business Process Mapping | Timeline ...
- Fishbone Diagrams | How Is A Timeline Graph Applied To Problem ...
- Revealing the Potential of Manufacturing Processes
- How to Create a Timeline Diagram | Timeline Diagrams | SYSML ...
- Project Timeline | Timeline Examples | How to Make a Timeline ...
- Process Flow Chart With Timeline Sample
- Business Process Mapping — How to Map a Work Process ...
- Project Timeline | Timeline Examples | How to Make a Timeline ...
- Timeline Examples | Project Timeline | How to Make a Timeline ...
- Conceptual diagram of the Kanban System | Value stream mapping ...
- Value stream mapping diagram
- Value stream mapping - Vector stencils library | Circuits and Logic ...
- Production Logistics Vsm
- Business diagrams & Org Charts with ConceptDraw DIAGRAM ...
- Project Timeline | Timeline Diagrams | Timeline Examples | Timeline ...
- Mac viruses timeline - Infographics | Plant Layout Plans | Marketing ...
- How to Make a Timeline | Project Timeline | Timeline Examples ...
- Principal cloud manufacturing | AWS Architecture Diagrams | Think ...