"Causes in the diagram are often categorized, such as to the 6 M's ...
The 6 Ms (used in manufacturing industry):
(1) Machine (technology);
(2) Method (process);
(3) Material (Includes Raw Material, Consumables and Information.);
(4) Man Power (physical work)/ Mind Power (brain work): Kaizens, Suggestions;
(5) Measurement (Inspection);
(6) Milieu/ Mother Nature (Environment).
The original 6Ms used by the Toyota Production System have been expanded by some to include the following and are referred to as the 8Ms. However, this is not globally recognized. It has been suggested to return to the roots of the tools and to keep the teaching simple while recognizing the original intent; most programs do not address the 8Ms.
(7) Management/ Money Power;
(8) Maintenance." [Ishikawa diagram. Wikipedia]
This 8Ms Ishikawa diagram (manufacturing cause and effect diagram) template is included in the Fishbone Diagram solution from the Management area of ConceptDraw Solution Park.
8Ms Ishikawa diagram

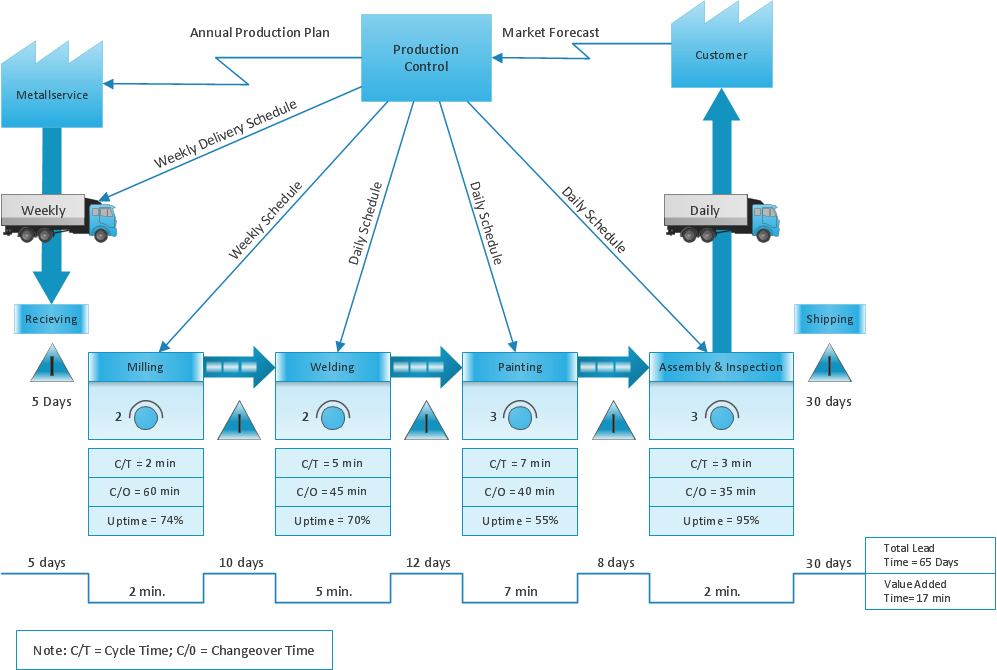
Value-Stream Mapping for Manufacturing

Bar Diagrams for Problem Solving. Create manufacturing and economics bar charts with Bar Graphs Solution

How Do Fishbone Diagrams Solve Manufacturing Problems

 Manufacturing and Maintenance
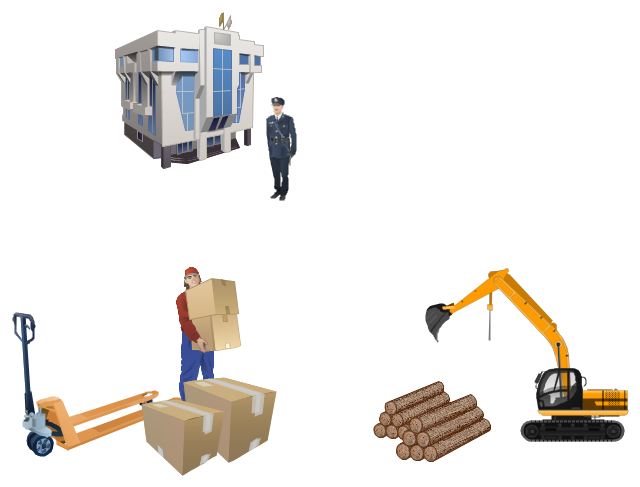
Manufacturing and maintenance solution extends ConceptDraw DIAGRAM software with illustration samples, templates and vector stencils libraries with clip art of packaging systems, industrial vehicles, tools, resources and energy.
Lean Manufacturing Diagrams

How to Build Cloud Computing Diagram Principal Cloud Manufacturing

The vector illustration template "Manufacturing and Maintenance" opens the libraries of vector clipart: Packaging, loading, customs; Industrial vehicles; Tools; Resources and energy.
The vector illustration template "Manufacturing and Maintenance" for the ConceptDraw PRO diagramming and vector drawing software is included in the Manufacturing and Maintenance solution from the Illustration area of ConceptDraw Solution Park.
The vector illustration template "Manufacturing and Maintenance" for the ConceptDraw PRO diagramming and vector drawing software is included in the Manufacturing and Maintenance solution from the Illustration area of ConceptDraw Solution Park.
Vector illustration
"Root cause analysis (RCA) is a method of problem solving that tries to identify the root causes of faults or problems.
RCA practice tries to solve problems by attempting to identify and correct the root causes of events, as opposed to simply addressing their symptoms. Focusing correction on root causes has the goal of preventing problem recurrence. RCFA (Root Cause Failure Analysis) recognizes that complete prevention of recurrence by one corrective action is not always possible.
Conversely, there may be several effective measures (methods) that address the root causes of a problem. Thus, RCA is an iterative process and a tool of continuous improvement.
RCA is typically used as a reactive method of identifying event(s) causes, revealing problems and solving them. Analysis is done after an event has occurred. Insights in RCA may make it useful as a preemptive method. In that event, RCA can be used to forecast or predict probable events even before they occur. While one follows the other, RCA is a completely separate process to Incident Management." [Root cause analysis. Wikipedia]
The root cause analysis (RCA) tree diagram example "Manufacturing problem solution" was created using the ConceptDraw PRO diagramming and vector drawing software extended with the solution "Seven Management and Planning Tools" from the Management area of ConceptDraw Solution Park.
Tree diagram

This picture graph sample shows how does manufacturing compare with other industries in U.S. It was designed using data from the U.S. Census Bureau website. [census.gov/ how/ img/ manufacturing_ 2014_ th.jpg]
"Manufacturing is the production of merchandise for use or sale using labour and machines, tools, chemical and biological processing, or formulation. The term may refer to a range of human activity, from handicraft to high tech, but is most commonly applied to industrial production, in which raw materials are transformed into finished goods on a large scale. Such finished goods may be used for manufacturing other, more complex products, such as aircraft, household appliances or automobiles, or sold to wholesalers, who in turn sell them to retailers, who then sell them to end users and consumers." [Manufacturing. Wikipedia]
The arrows bar chart example "Manufacturing in America" was created using the ConceptDraw PRO diagramming and vector drawing software extended with the Picture Graphs solution from the Graphs and Charts area of ConceptDraw Solution Park.
Arrows bar chart

Data Flow Diagram Model

Cross Functional Flowchart Examples

Lean Value Stream Map
- Manufacturing 8 Ms fishbone diagram - Template | How Do ...
- Lean Manufacturing Diagrams | How Do Fishbone Diagrams Solve ...
- How Do Fishbone Diagrams Solve Manufacturing Problems ...
- Manufacturing Process Flow Chart
- Value-Stream Mapping for Manufacturing | Picture Graphs | Lean ...
- Manufacturing Floor Plan Layout
- Process Flowchart | Data Flow Diagram Model | Manufacturing 8 Ms ...
- Manufacturing and Maintenance | How Do Fishbone Diagrams ...
- Root cause analysis tree diagram - Manufacturing problem solution
- Computer Manufacturing Process Flow Chart
- How Do Fishbone Diagrams Solve Manufacturing Problems | Cause ...
- Value-Stream Mapping for Manufacturing | Process Flowchart | Mind ...
- The Best Implementation Process for Marine Manufacturing
- Root cause analysis tree diagram - Manufacturing problem solution ...
- Lean Manufacturing Diagrams | Value-Stream Mapping for ...
- Value-Stream Mapping for Manufacturing | Quality Control | How Do ...
- Er Diagram For Manufacturing Industry
- ER Model Manufacturing Company
- Lean Manufacturing Diagrams | Lean Six Sigma Diagram Software ...
- Manufacturing Block Diagrams