 Picture Graphs
Typically, a Picture Graph has very broad usage. They many times used successfully in marketing, management, and manufacturing. The Picture Graphs Solution extends the capabilities of ConceptDraw DIAGRAM with templates, samples, and a library of professionally developed vector stencils for designing Picture Graphs.
This picture graph sample shows how does manufacturing compare with other industries in U.S. It was designed using data from the U.S. Census Bureau website. [census.gov/ how/ img/ manufacturing_ 2014_ th.jpg]
"Manufacturing is the production of merchandise for use or sale using labour and machines, tools, chemical and biological processing, or formulation. The term may refer to a range of human activity, from handicraft to high tech, but is most commonly applied to industrial production, in which raw materials are transformed into finished goods on a large scale. Such finished goods may be used for manufacturing other, more complex products, such as aircraft, household appliances or automobiles, or sold to wholesalers, who in turn sell them to retailers, who then sell them to end users and consumers." [Manufacturing. Wikipedia]
The arrows bar chart example "Manufacturing in America" was created using the ConceptDraw PRO diagramming and vector drawing software extended with the Picture Graphs solution from the Graphs and Charts area of ConceptDraw Solution Park.
Arrows bar chart

 Basic Picture Graphs
This solution extends the capabilities of ConceptDraw DIAGRAM (or later) with templates, samples and a library of vector stencils for drawing Picture Graphs.
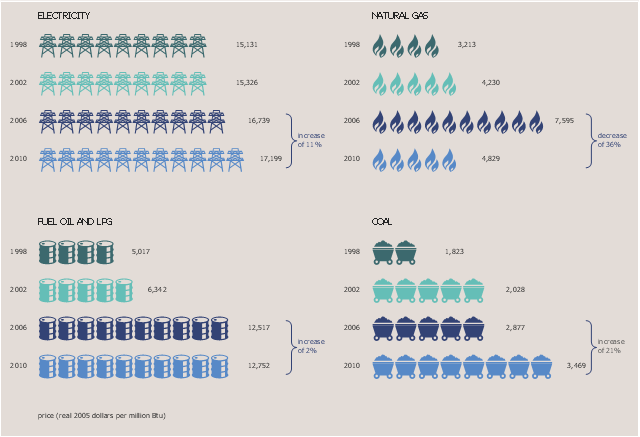
This picture bar graphs sample shows the average energy prices for manufacturers (1998-2010). It was designed on the base of data of the article "Cost of Natural Gas Used in Manufacturing Sector Has Fallen" from the website of the U.S. Energy Information Administration (EIA). [eia.gov/ consumption/ manufacturing/ reports/ 2010/ ng_ cost/ ?src=%E2%80%B9%20 Consumption%20 %20 %20 %20 %20 %20 Manufacturing%20 Energy%20 Consumption%20 Survey%20 (MECS)-f1]
The pictorial charts example "Average energy prices for manufacturers" was created using the ConceptDraw PRO diagramming and vector drawing software extended with the Picture Graphs solution from the Graphs and Charts area of ConceptDraw Solution Park.
The pictorial charts example "Average energy prices for manufacturers" was created using the ConceptDraw PRO diagramming and vector drawing software extended with the Picture Graphs solution from the Graphs and Charts area of ConceptDraw Solution Park.
Picture bar graphs
Used Solutions
Lean Six Sigma Diagram Software

Lean Manufacturing Diagrams

Industrial transport - Design elements

 Manufacturing and Maintenance
Manufacturing and maintenance solution extends ConceptDraw DIAGRAM software with illustration samples, templates and vector stencils libraries with clip art of packaging systems, industrial vehicles, tools, resources and energy.
Basic Flowchart Images. Flowchart Examples

Value-Stream Mapping for Manufacturing

Rail transport - Design elements

How Do Fishbone Diagrams Solve Manufacturing Problems

Organizational Chart Template

 Astronomy
Astronomy solution extends ConceptDraw DIAGRAM software with illustration and sketching software with templates, samples and libraries of a variety of astronomy symbols, including constellations, galaxies, stars, and planet vector shapes; a whole host of cele
Value Stream Diagram

Quality Engineering Diagrams

Risk Analysis


Bar Charts

Learn how to create a current state value stream map

Geo Map - Europe - Belarus

- Lean Manufacturing Diagrams | Value-Stream Mapping for ...
- Manufacturing in America | Picture Graphs | Picture Chart Of ...
- Basic Flowchart Images . Flowchart Examples | Manufacturing and ...
- Rich Picture Diagram Of Manufacturing Process
- Pictures For Quality
- Flow Chart Process Of Manufacturing Pics
- Picture graph - Template | Manufacturing in America | Total value of ...
- Tool Of Lean Manufacturing Picture
- TQM Diagram Tool | Picture Graphs | Seven Basic Tools of Quality ...
- Bio Flowchart | Production Function Flowchart Images
- Industrial transport - Design elements | Spatial infographics Design ...
- Tools - Vector stencils library | Masonry Tools And Their Uses With ...
- Cause and Effect Analysis - Fishbone Diagrams for Problem Solving ...
- Organizational Charts | Basic Flowchart Images . Flowchart ...
- Picture graphs - Vector stencils library | Design elements - Picture ...
- Manufacturing 8 Ms fishbone diagram - Template | Fishbone ...
- UML Use Case Diagram. Design Elements | UML Diagram Types ...
- Drawing Illustration | Picture Graphs | How to Create a Picture ...
- Rainfall Bar Chart | Chart Maker for Presentations | Picture Graph ...
- Pictures Of Vehicles That Move On Water Clipart