Business Process Mapping — How to Map a Work Process

 Business Processes
Business Process solution extends ConceptDraw PRO software with business process diagrams as cross-functional flowcharts, workflows, process charts, IDEF0, timelines, calendars, Gantt charts, business process modeling, audit and opportunity flowcharts.
HelpDesk
How to Create a Timeline Diagram in ConceptDraw PRO

 Timeline Diagrams
Timeline Diagrams solution extends ConceptDraw PRO software with templates, samples and library of vector stencils for drawing the timeline and milestones diagrams.
How to Make a Timeline

The vector stencils library "Value stream mapping" contains 43 VSM symbols.
Use it for drawing value stream maps in the ConceptDraw PRO diagramming and vector drawing software extended with the Value Stream Mapping solution from the Quality area of ConceptDraw Solution Park.
www.conceptdraw.com/ solution-park/ business-value-stream-mapping
Use it for drawing value stream maps in the ConceptDraw PRO diagramming and vector drawing software extended with the Value Stream Mapping solution from the Quality area of ConceptDraw Solution Park.
www.conceptdraw.com/ solution-park/ business-value-stream-mapping
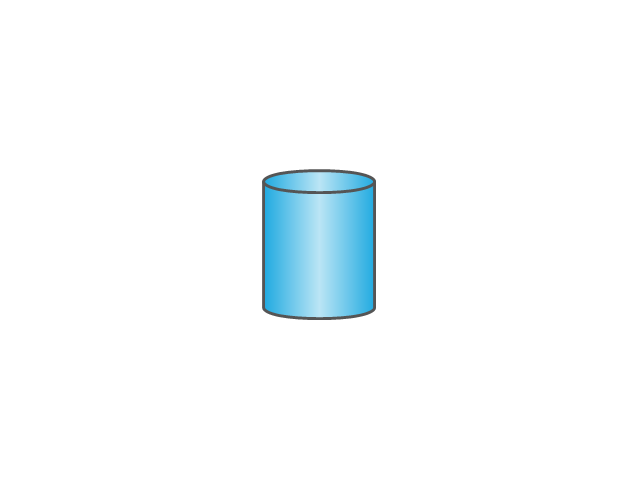
Inventory

Inventory

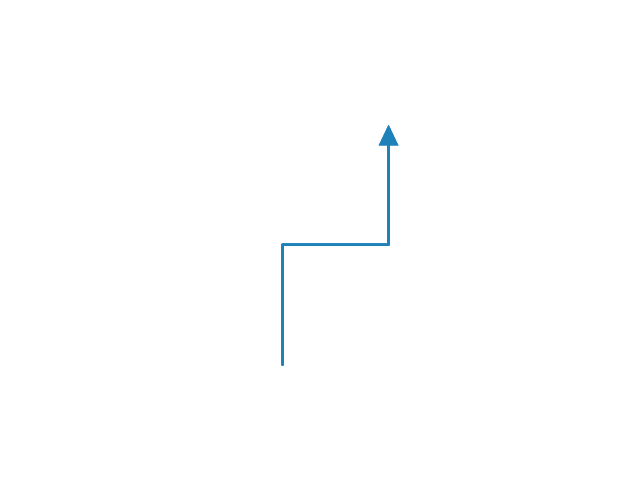
Information Flow
Shipment
Shipment

Material Flow
Material Pull

FIFO Line
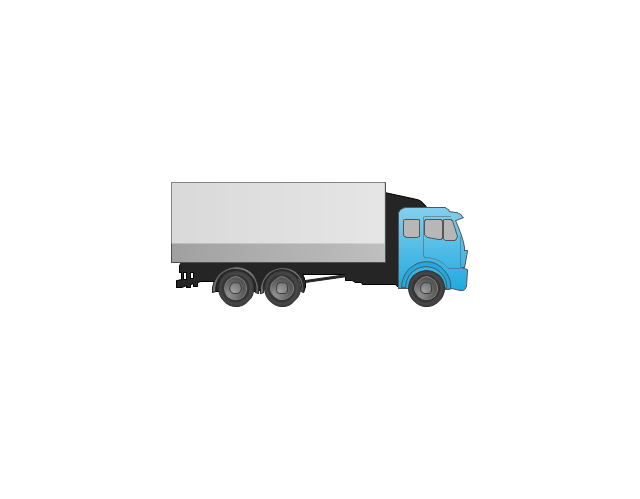
Truck shipment/Logistics
Customer/Supplier

Dedicated Process

Shared Process
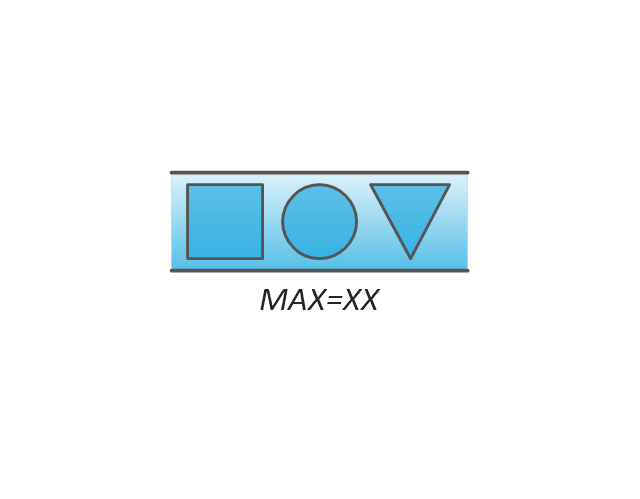
Supermarket Parts

Data Box
Workcell

Kaizen Burst

Operator

Other
Production Control
Manual Info
Electronic Information Flow
Production Kanban

Withdrawal Kanban

Signal Kanban
Kanban Post

Sequenced Pull

Load Levelling

MRP/ERP
Go-See

Pull Arrow
Manual Info
Pull Arrow
Timeline Total
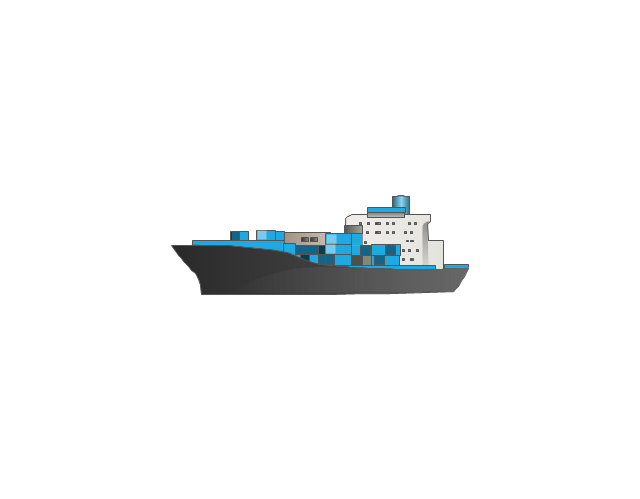
Ship
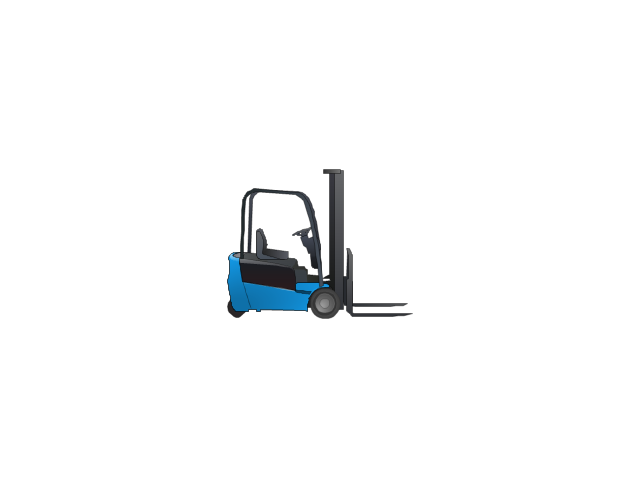
Forklift Truck
Plane

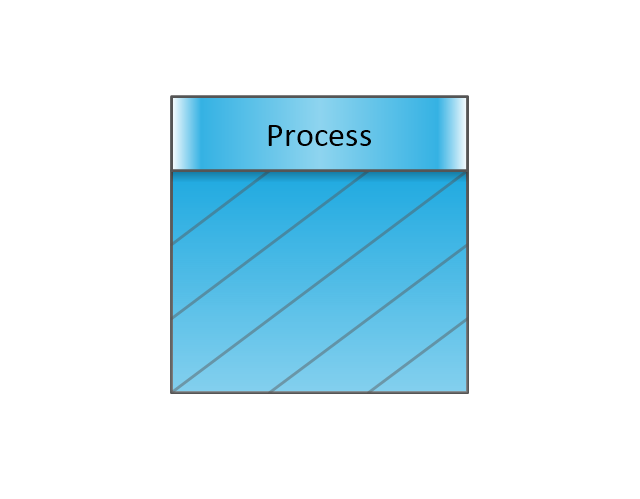
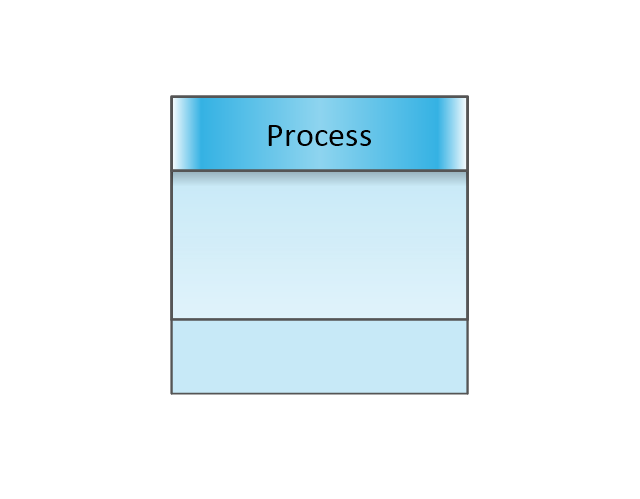
Process with Data
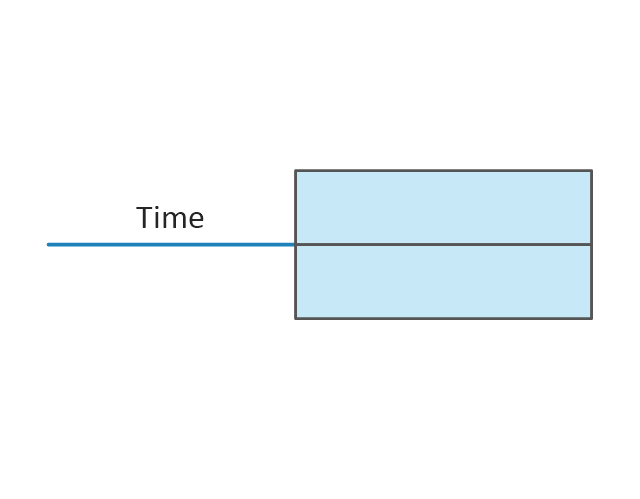
Timeline
Timeline
Supermarket, 2

Supermarket, 3

Safety stock, 2

Safety stock, 3

Business Process Modeling Notation

Business Process Modeling with ConceptDraw

Business Process Modeling Notation Template
 B2B process diagram BPMN 2.0 - Cab booking process")
"Value Stream Map (VSM)
1. A tool used to improve a process by identifying added value and eliminating waste.
2. A process map that follows the value creation process.
A. “strap yourself to the product (or service) and see where you go”
3. A process map with data added.
A. Times: processing, wait, cycle.
B. Quality: number of rejects.
C. Inventory.
D. Resources.
1) Number of people.
2) Space.
3) Distance traveled.
E. Whatever else is useful for analyzing the process." [ocw.mit.edu/ courses/ aeronautics-and-astronautics/ 16-660j-introduction-to-lean-six-sigma-methods-january-iap-2012/ lecture-notes/ MIT16_ 660JIAP12_ 1-6.pdf]
This sample VSM flowchart shows the value stream in a manufacturing, production control and shipping processes.
This value stream mapping diagram example was created using the ConceptDraw PRO diagramming and vector drawing software extended with the Value Stream Mapping solution from the Quality area of ConceptDraw Solution Park.
Value stream mapping

Business Process Modeling Resume
 business process model diagram BPMN 2.0 - Booking")
The Best Business Process Modeling Software


Business Process Management
 business process diagram BPMN 2.0 - Trouble ticket system")
Activity Network (PERT) Chart

- Drawing A Timeline In Business Process Mapping
- Timeline - Template | Project Timeline | How to Make a Timeline ...
- Timeline Diagrams | Timeline Diagrams | ConceptDraw Solution ...
- Business Processes | How to Create a Timeline Diagram in ...
- Timeline Diagrams
- Timeline Diagrams | Process Flowchart | Timeline Diagrams | Time ...
- How to Create a Timeline Diagram in ConceptDraw PRO | Timeline ...
- Timeline Diagrams | Process Flowchart | Timeline Diagrams | Time ...
- Timeline Chart Collaborative Process
- Timeline Diagrams | Process Flowchart | Basic Flowchart Symbols ...
- Process Flowchart | Basic Flowchart Symbols and Meaning | Best ...
- Process Flow Chart With Timeline Sample
- Event-driven Process Chain Diagrams | Timeline Diagrams ...
- Program Timeline
- Process Flowchart | Basic Flowchart Symbols and Meaning | How to ...
- Process Flowchart | ConceptDraw PRO Network Diagram Tool ...
- How to Create a Timeline Diagram in ConceptDraw PRO | Business ...
- Event-driven Process Chain (EPC) Diagram Software | How to ...
- Activity Network Diagram Method | Process Flowchart | Timeline ...