Chart Maker for Presentations
Easy charting software comes with beautiful chart templates and examples. This makes it easy to create professional charts without prior experience.Rainfall Bar Chart
This sample shows the Horizontal Bar Chart of the average monthly rainfalls. This sample was created in ConceptDraw DIAGRAM diagramming and vector drawing software using the Bar Graphs Solution from the Graphs and Charts area of ConceptDraw Solution Park.Sales Growth. Bar Graphs Example
This sample was created in ConceptDraw DIAGRAM diagramming and vector drawing software using the Bar Graphs Solution from Graphs and Charts area of ConceptDraw Solution Park. It is Bar Graphs example, Sales Growth example, Column Chart Example - Sales Report.Column Chart Examples
Column chart examples from ConceptDraw collection can help you find the best visual depiction for you data. You can easily modify column chart examples according to data you want to visualize.HelpDesk
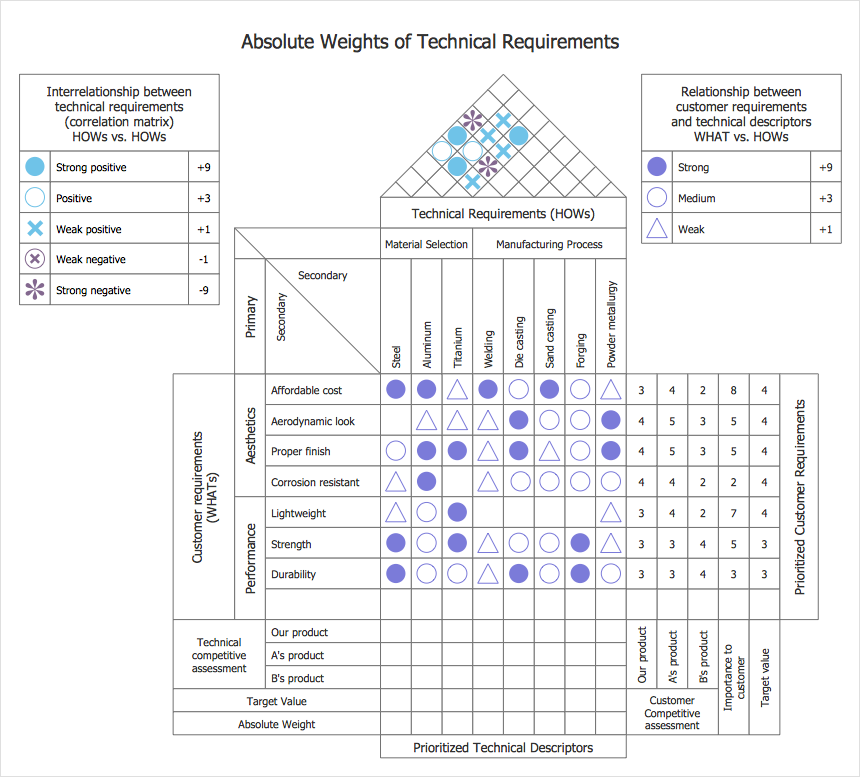
How to Create a House of Quality Diagram
The House of Quality diagram is a part of quality function deployment method (QFD) designed by Japanese planning specialists to help turn customer requirements (voice of the customer) into technical features of a final product. The House of Quality solution for ConceptDraw DIAGRAM is a tool for designing HOQ diagrams. There are 2 libraries containing 54 vector stencils you can use to create House of Quality diagrams of any type.What Is a Line Chart
What Is a Line Chart? A line chart is a basic type of chart represented by a series of data points connected with a straight line. Explaining the meaning of “What is a line chart?” is convenient to use illustrations with professional looking line charts designed in ConceptDraw DIAGRAM diagramming and vector drawing software extended with Line Graphs solution from the Graphs and Charts area.Metro Maps
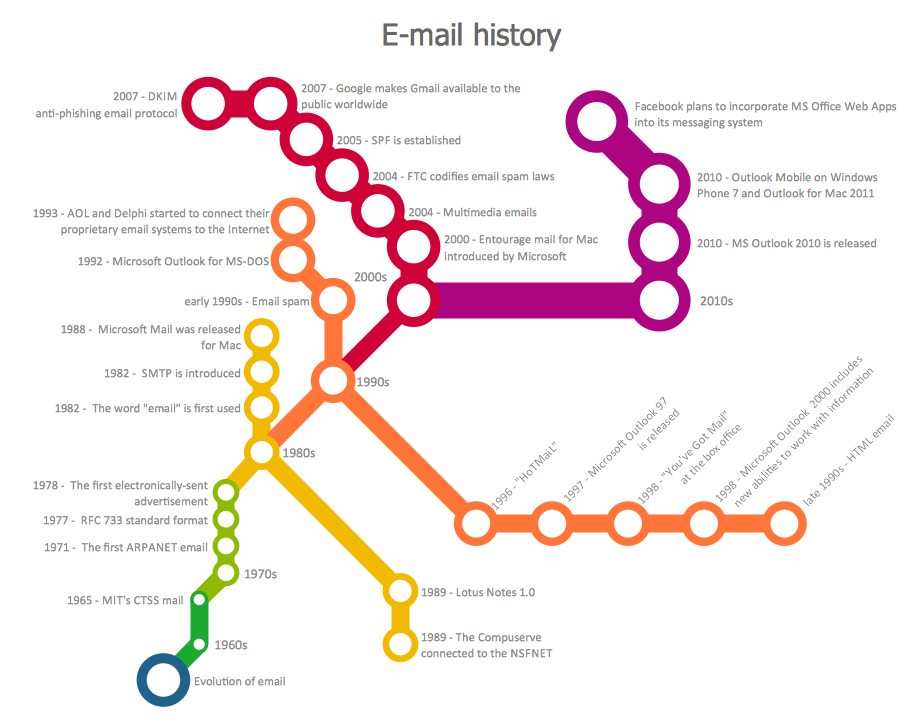
ConceptDraw DIAGRAM software enhanced with Metro Map Solution from the Maps Area of ConceptDraw Solution Park provides extensive drawing tools for fast and easy creating various metro maps, route maps, transport schemes, metro path maps, subway train maps, and many other types of maps.Deployment Chart Software
ConceptDraw DIAGRAM extended with Matrices solution from the Marketing area of ConceptDraw Solution Park is the best Deployment Chart Software. The Matrices solution offers you the useful tools for creating Deployment Charts in just minutes. The Deployment Charts designed with ConceptDraw DIAGRAM are vector graphic documents and are available for reviewing, modifying, converting to a variety of formats (image, HTML, PDF file, MS PowerPoint Presentation, Adobe Flash or MS Visio XML), printing and send via e-mail in one moment.Purchase Process Flow Chart, Receiving Process Flow Chart, Accounting Flowchart Example.
The purchasing process follows very specific guidelines and includes a purchasing cycle flowchart and receiving process flow chart. Common key elements of purchasing process. It is important to know how purchasing processes work and how each operation is done.Matrix Organization Structure
Matrix organizational structure is one of the main forms of structures which is actively used by organizations to carry forth the functions of a company visually and effectively. Now we have ConceptDraw DIAGRAM diagramming and vector drawing software extended with 25 Typical Orgcharts solution from the Management area of ConceptDraw Solution Park which will help easy represent matrix organizational structure of any degree of complexity.SDL Flowchart Symbols
Drawing the diagrams we try to find in help the powerful software and now we have the ConceptDraw DIAGRAM. The ability easily create the SDL diagrams is made possible thanks to unique Specification and Description Language (SDL) Solution from the Industrial Engineering Area of ConceptDraw Solution Park. This solution extends ConceptDraw DIAGRAM libraries - SDL Connectors and SDL Diagrams that contain 70 predesigned SDL flowchart symbols.
 Scrum Workflow
The Scrum Workflow Solution extends the capabilities of ConceptDraw DIAGRAM with a large collection of professionally-designed samples and a selection of ready-to-use scrum design elements: scrum diagrams and arrows, scrum icons of people, artifacts, workflow, workspace and other colorful scrum clipart, and also scrum charts.
Pyramid Charts
ConceptDraw DIAGRAM extended with Pyramid Diagrams Solution from the Marketing Area of ConceptDraw Solution Park is a powerful Pyramid Charts making software. A Pyramid Chart has the form of triangle and hierarchically structures, organizes and help to analyze the information, data or ideas. Triangle is divided on the sections that usually have different widths. The width indicates the level of hierarchy among the topics.Online Flow Chart
ConceptDraw DIAGRAM diagramming and vector drawing software extended with tools of Flowcharts Solution from the "Diagrams" Area of ConceptDraw Solution Park ideally suits for fast and easy Online Flow Chart designing. We propose to verify this right now.Chart Templates
Easy charting software comes with beautiful chart templates and examples. This makes it easy to create professional charts without prior experience.School Floor Plans
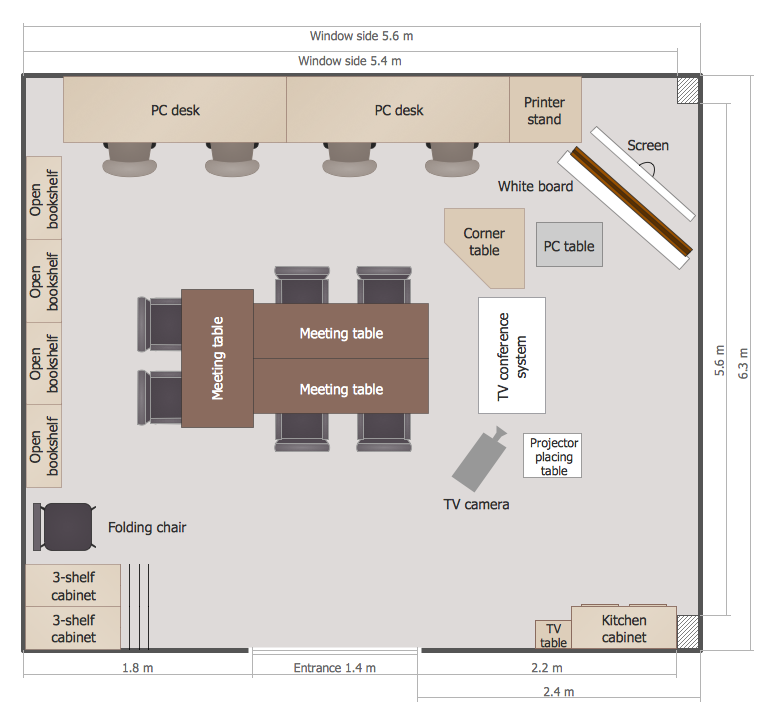
ConceptDraw DIAGRAM is a powerful diagramming and vector drawing software. Extended with School and Training Plans Solution from the Building Plans Area it became the best software for quick and easy designing various School Floor Plans.Relative Value Chart Software
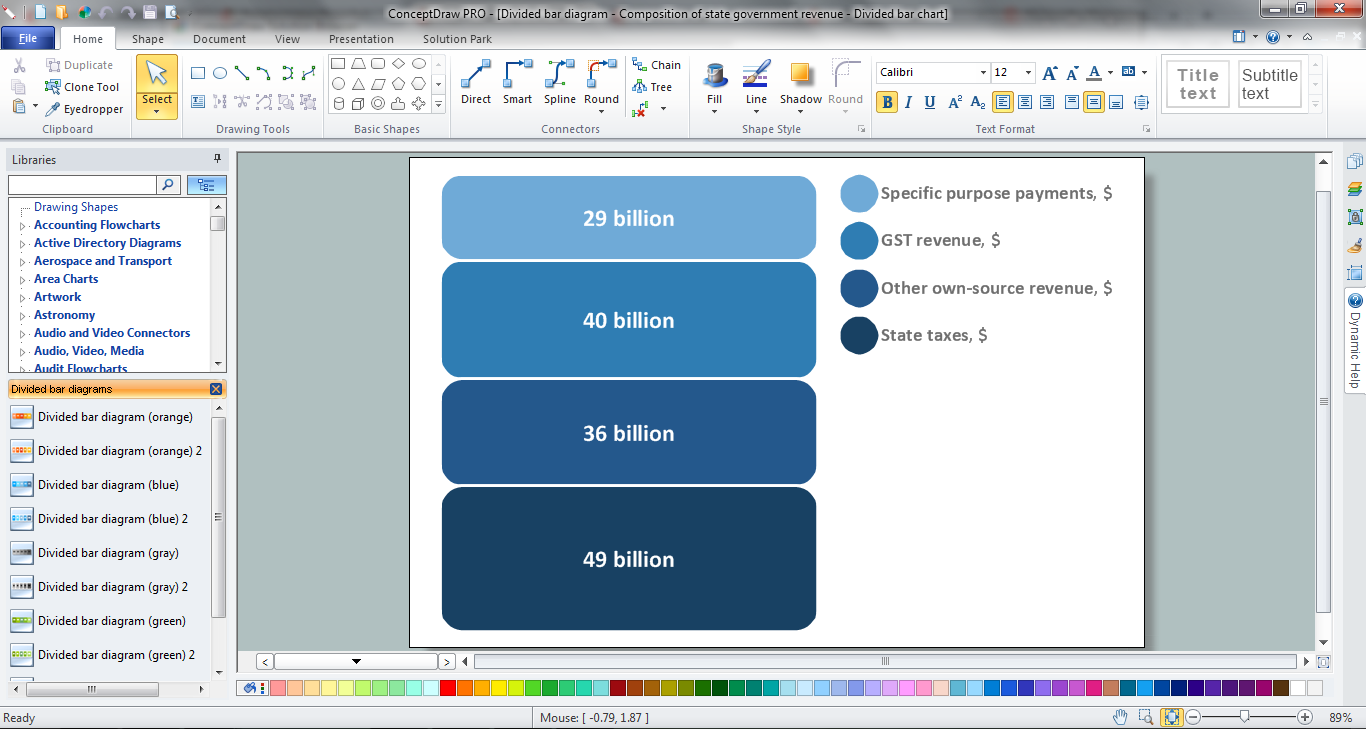
Relative value is a value measured in the terms of liquidity, risks, return of one investment or financial instrument relative to another. Relative values are widely used in:business, economics, investment, management, marketing, statistics, etc. ConceptDraw DIAGRAM software is the best for drawing professional looking Relative Value Charts. ConceptDraw DIAGRAM provides Divided Bar Diagrams solution from the Graphs and Charts Area of ConceptDraw Solution Park.Flow Chart Creator
It is impossible to imagine the managing and analyzing of business and technical processes without flowcharts. They are the best way to visually represent the structural data, algorithms, the steps of the process, they allow to illustrate the process flow direction and solution to a given problem. ConceptDraw DIAGRAM diagramming and vector drawing software extended with flowchart maker and Flowcharts Solution from the "Diagrams" Area is a powerful Flow Chart Creator.
 Bar Graphs
The Bar Graphs solution enhances ConceptDraw DIAGRAM functionality with templates, numerous professional-looking samples, and a library of vector stencils for drawing different types of Bar Graphs, such as Simple Bar Graph, Double Bar Graph, Divided Bar Graph, Horizontal Bar Graph, Vertical Bar Graph, and Column Bar Chart.
Stacked Graph
ConceptDraw DIAGRAM is a powerful software for drawing professional looking Stacked Graph thanks to the Divided Bar Diagrams solution from the Graphs and Charts area of ConceptDraw Solution Park.- Mechanical Engineering | Pipe Welding Symbols Chart Pdf
- Electrical Engineering | Electronic Schematic Symbols Chart Pdf
- Multiple Bar Chart Pdf
- International education | Minnesota measures - Infogram | Column ...
- Minnesota measures - Infogram | Education infogram - Template ...
- Sales KPIs and Metrics - Vector stencils library | Design elements ...
- Education charts - Vector stencils library | Design elements ...
- Data-driven charts - Vector stencils library | Design Elements - Data ...
- Welding Symbols Chart Pdf
- Cafe and Restaurant Floor Plans | Restaurant Bar Floor Plans Pdf
- Geo Map — South America Continent | How to Draw Pictorial Chart ...
- Design elements - Line graphs | Design elements - Time series ...
- Electrical Plan Layout Pdf India
- Chart Maker for Presentations | Serious crime in Cincinnati | Column ...
- House of Quality - correlation matrix | House of Quality - customer's ...
- Percentage Pie Chart . Pie Chart Examples | Pie Graph Worksheets ...
- Export from ConceptDraw DIAGRAM Document to PDF (Adobe ...
- Mechanical Symbols Chart Download
- Design elements - TQM diagram | How to Create a TQM Diagram ...
- Gauge Chart


